
Agriculture & FoodAvailable
Production & Food Balances
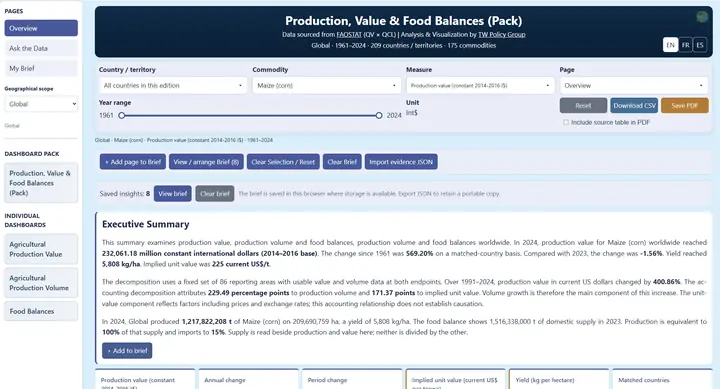
What does a country produce, how has output changed, and how is food supply used?
3 dashboardsProduction Volume · Production Value · Food Balances
Agriculture & Food
Production, workforce, trade and prices.Finance & Development
Public, private and development finance, and the economy around it.Fisheries & Aquaculture
Production, trade, market access and livelihoods.Evidence platforms built on FAO, OECD, WTO, World Bank, WITS and ILO statistics. Select a country and product, explore decades of data, and export a documented country or sector evidence brief in one click, or commission one from our analysts.
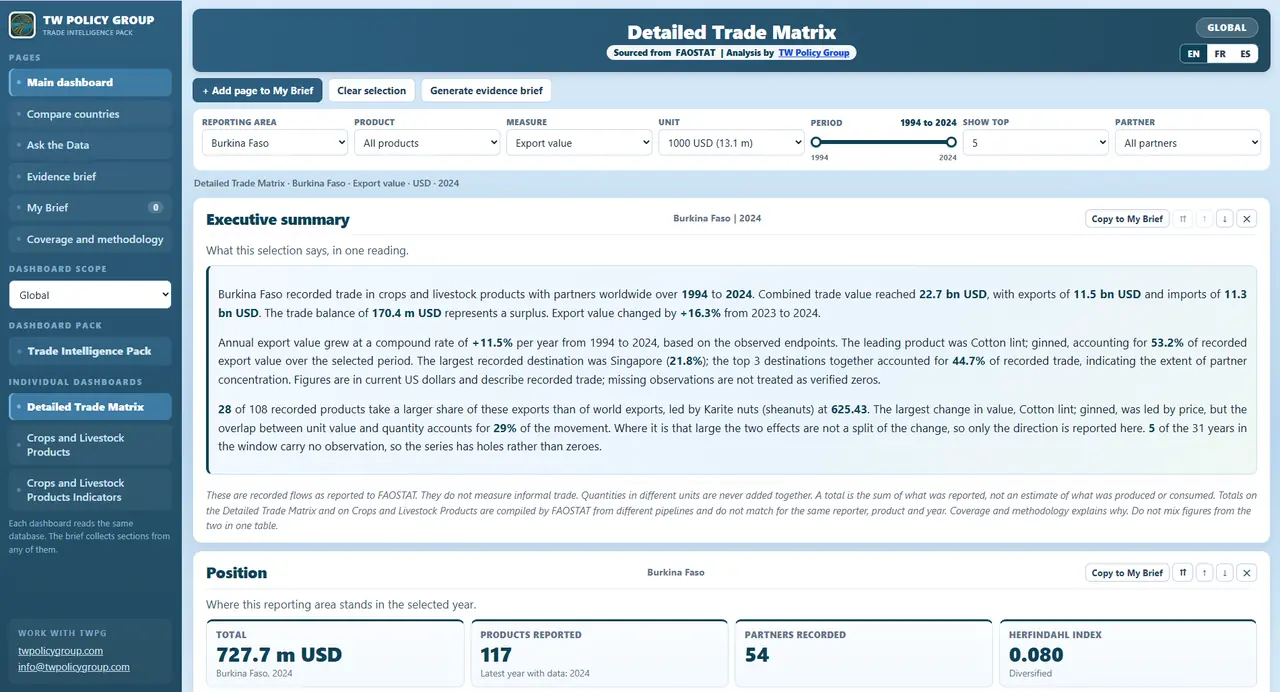
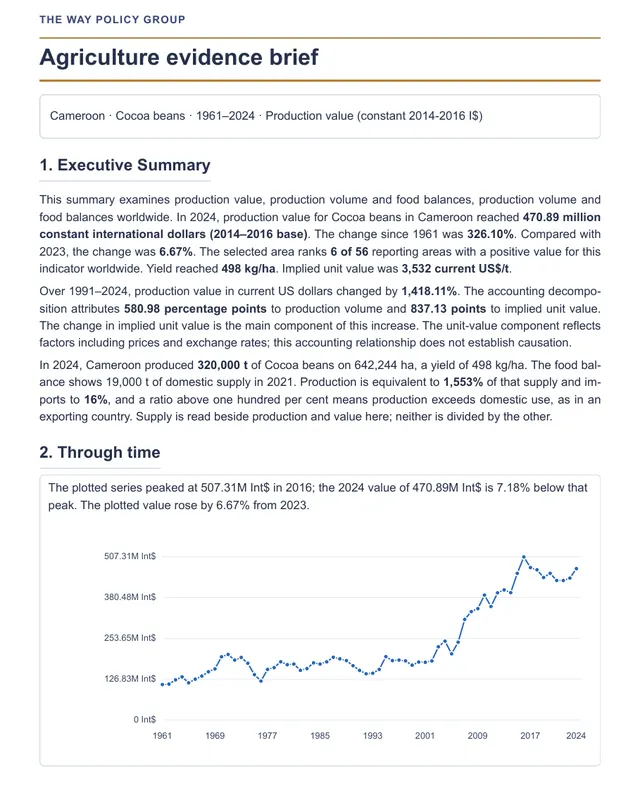
Each platform groups related dashboards and produces one connected evidence brief. Every dashboard is also available on its own.
Production, workforce, trade and prices.
What does a country produce, how has output changed, and how is food supply used?
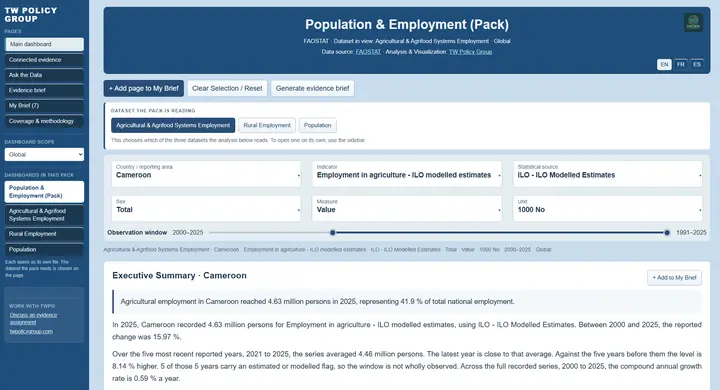
How many people work in agriculture and agrifood systems, and how is the population changing?
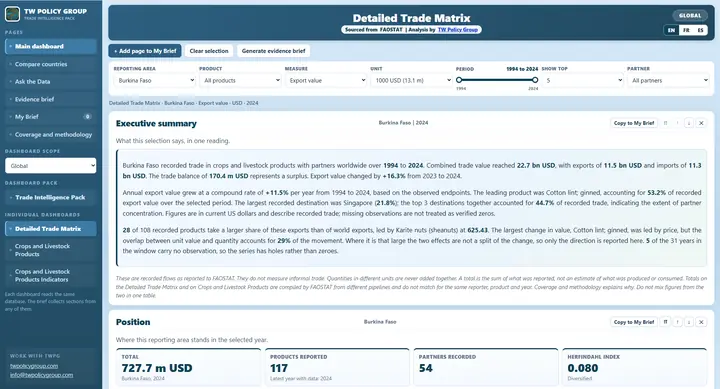
Which markets and suppliers matter for a product, and how exposed is a country to them?
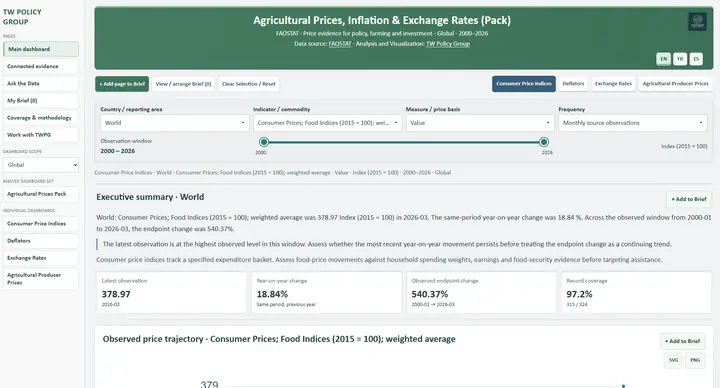
How have producer prices, inflation and exchange rates moved, and what does that mean in real terms?
Public, private and development finance, and the economy around it.
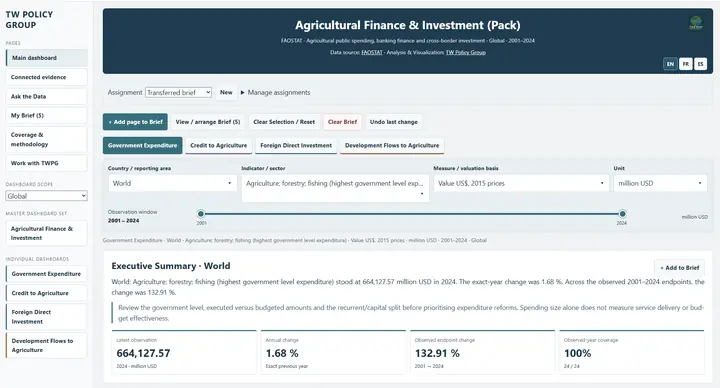
How much public, private and development finance reaches agriculture, relative to the sector's weight?
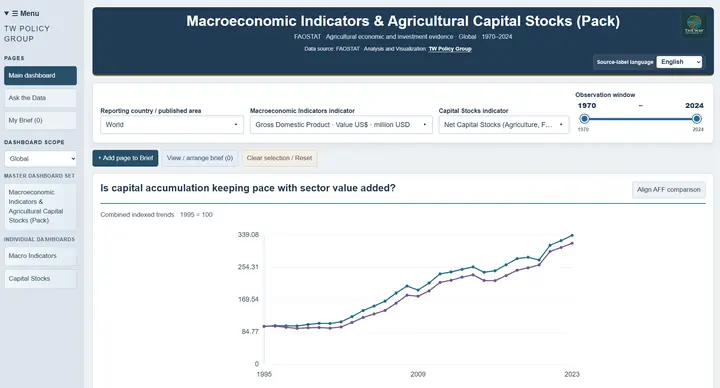
How large is agriculture in the economy, and is capital keeping pace with the sector?
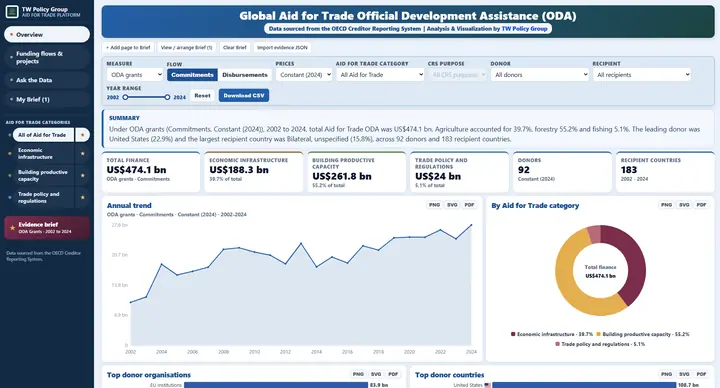
Which donors and purposes fund a country's trade capacity, and through which channels?
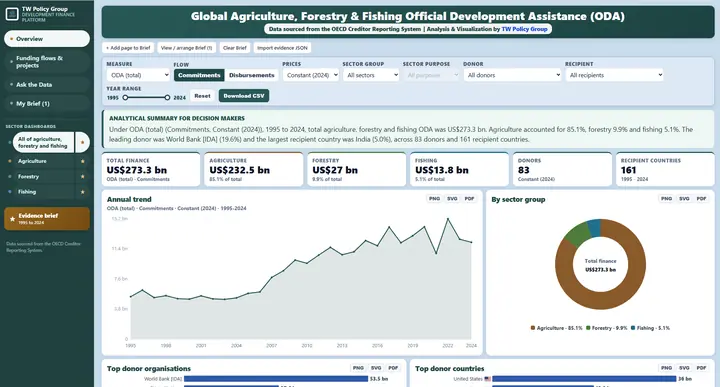
Who funds agriculture, forestry and fishing in a country, and for what purposes?
Production, trade, market access and livelihoods.
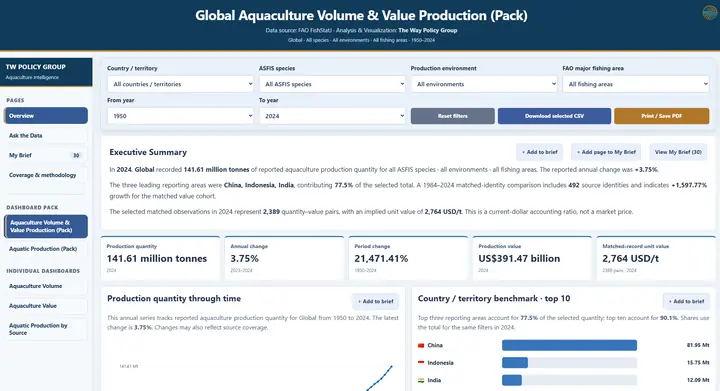
What does a country catch, farm and process, and how is that changing?
Where does a country's seafood go, and where do shipments meet border rejections?
How many people fish and farm fish, and how does that relate to production?
Executive summary, KPIs, trends, peer benchmarks, takeaways and a methods annex, built from the same calculations as the dashboard.
Read sample briefsFrom government to investors. Answers are computed from the same records as the charts, never guessed.
One selection across a platform. Each figure stays on its own basis and is never added across sources.
Every brief can carry key takeaways and the checks to run before acting on them.
Briefs as PDF or editable Word, data as CSV, charts as PNG, SVG or PDF.
Source, years, units and flags on every page. Missing years stay missing, never zero. In English, French and Spanish.
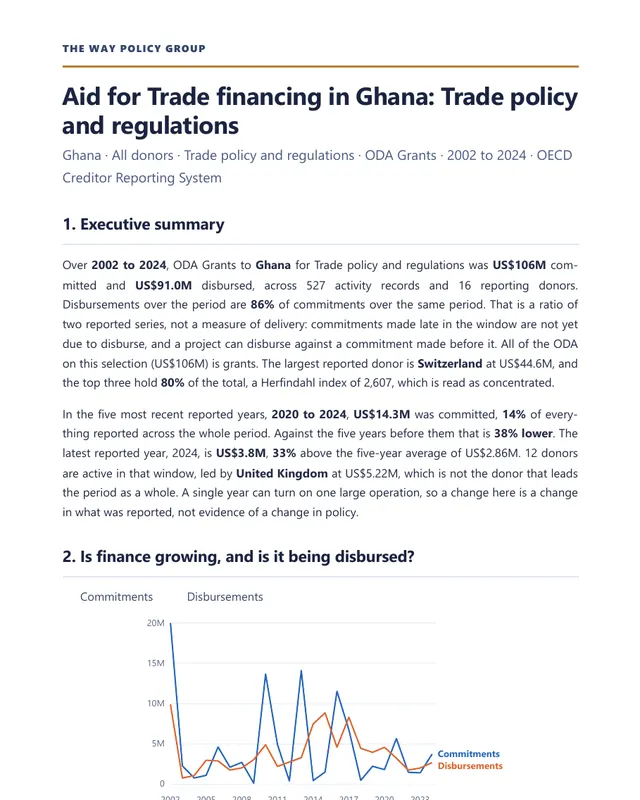
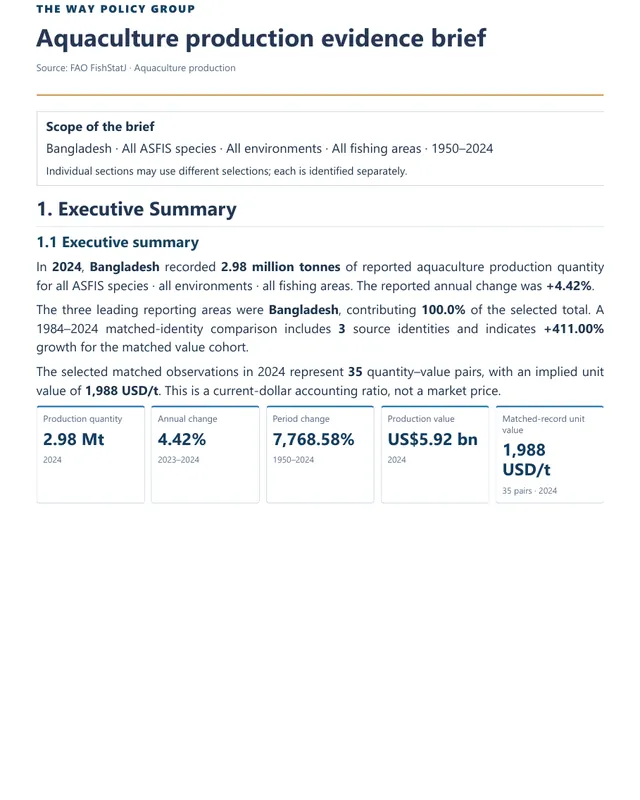
Interactive dashboards with long annual series, country and peer comparisons, and an evidence brief you build from your own selections.
Tell us the decision. We scope the evidence, check the calculations and deliver a brief that sets out findings, limitations and next questions.
Who we work with

Emmanuel Besong founded The Way Policy Group in 2024 after work in public agricultural finance and international trade policy.
No institutional endorsement is implied.
Send the country, product and question. We reply with the relevant evidence and a proportionate next step.