
Agricultural Production & Food Balances
What does a country produce, how has output changed, and how is food supply used?
Production volume and value for crops and livestock, with food balance sheets showing how domestic supply is formed and used. Compare 209 countries and territories across 175 commodities since 1961.
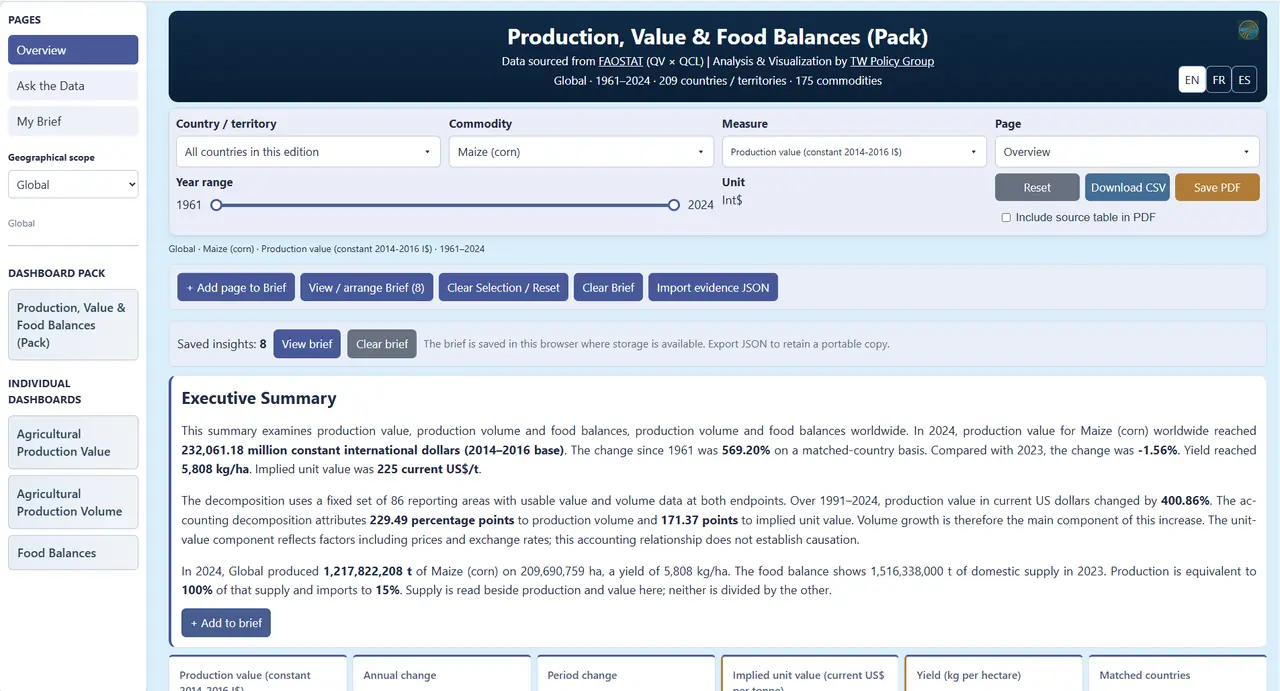
Evidence for three recurring decisions.
Set sector priorities
See which commodities carry the most output and value before choosing where a review should start.
Benchmark performance
Compare area, yield, production and value with peers over six decades.
Read supply in context
See how domestic supply is formed and used, including self-sufficiency and import dependency.
Built for the people who make or support these decisions.
How much of this commodity do we grow ourselves, and how dependent are we on imports?
Which commodities is our country least self-sufficient in?
What moved production value: volume or unit value?
How much of this commodity is lost after harvest?
3 dashboards, one connected brief.
Each dashboard is available on its own or as part of the platform. All include Ask the Data, My Brief, coverage notes and CSV and chart exports.
Production Volume
Area harvested, yield and production quantity for crops and livestock products by country and region.
Subscribe to this dashboardProduction Value
Gross production value in constant and current terms, showing which products carry the most economic weight.
Subscribe to this dashboardFood Balances
Supply and utilisation: production, imports, exports, stock changes, food, feed, other uses and supply per person.
Subscribe to this dashboardHighlights
- Volume and unit-value contributions: what moved production value
- Self-sufficiency, import dependency and where domestic supply goes
- Post-harvest losses recorded in the food balance
- Food supply per person for a single country
- Commodity portfolio and country comparison, with overlapping groups never summed
- Questions written for six stakeholder groups, from government to research
A documented brief in one click.
Choose country, product or measure, years and peers, then generate the brief in one click. It is built from the same calculations as the dashboard, with every figure labelled and a methods annex at the end.
- Executive summary
- Headline KPIs
- Trends through time
- Peer benchmarks
- Composition and drivers
- Stakeholder questions
- Methods and coverage annex
- Sources and caveats
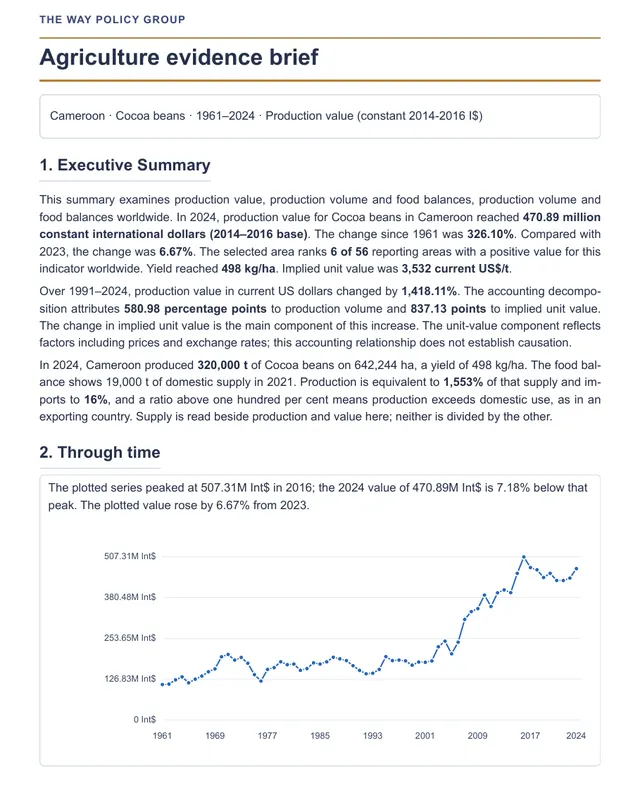
Cameroon · Cocoa beans
- Executive summary
- Through time
- Country benchmark
- What moved the value
- Value, volume and unit value indices
- How domestic supply is formed
- Self-sufficiency and import dependency
- Food supply per person
Two more samples for this platform will be added: {{PDF_PLATFORM01_SAMPLE_2}} {{PDF_PLATFORM01_SAMPLE_3}}
What the data covers.
| Source | FAOSTAT Production (QCL), Value of Production (QV), Food Balances (FBS) |
|---|---|
| Years | 1961 to 2024 |
| Coverage | 209 countries and territories, 175 commodities; global and five regional editions |
| Frequency and units | Annual · tonnes, hectares, kg/ha, constant international dollars, current US dollars |
What it does not tell you.
- Annual data in FAO commodity classification, not HS.
- Gross production value is measured at the farm gate. It is not value added, profit or realised sales.
- Food balances describe supply and utilisation, not measured household intake or who is undernourished.
- Published aggregates and overlapping area groups are never added to their components.
- The agri-food trade section is part of the platform only, not the individual dashboards.
Choose how to use this platform.
Single dashboard
One dashboard from this platform, full series.
per year, one user
- Full historical coverage
- Dashboard evidence brief
- CSV and chart exports
Full platform
Every dashboard plus the connected platform brief.
per year, one user
- All 3 dashboards
- Connected evidence brief
- English, French and Spanish
- Onboarding session
Institutional or commissioned
Team licence, analyst-prepared brief or scoped review.
quoted after scoping
- Multi-user access
- Reviewed country brief
- Training and support
Not ready to buy? Open the free five-year preview.
How do I get access after paying?
You receive login details for My Dashboards, where the platform and its dashboards open.
How often is the data updated?
When the source publishes a new release. Each dashboard shows its source and version.
Which languages are supported?
Dashboards and briefs are available in English, French and Spanish.
Can you prepare a brief for my exact question?
Yes. Send the country, product and decision and we will propose a scope and quote.
Can I reuse the charts in my reports?
Yes, within the licence terms and the source conditions. Embedding and white-label use are agreed separately.
Related platforms
All platforms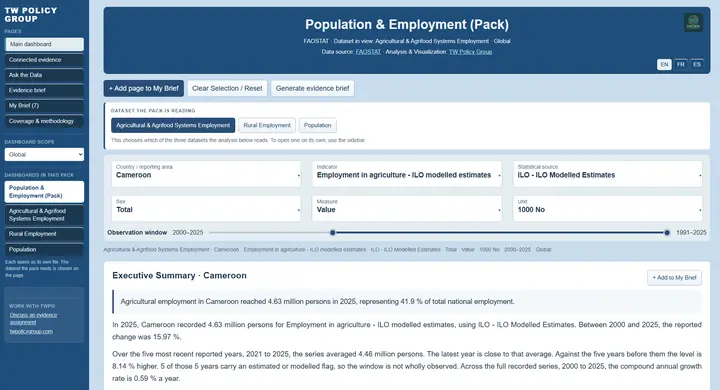
Population & Employment
How many people work in agriculture and agrifood systems, and how is the population changing?
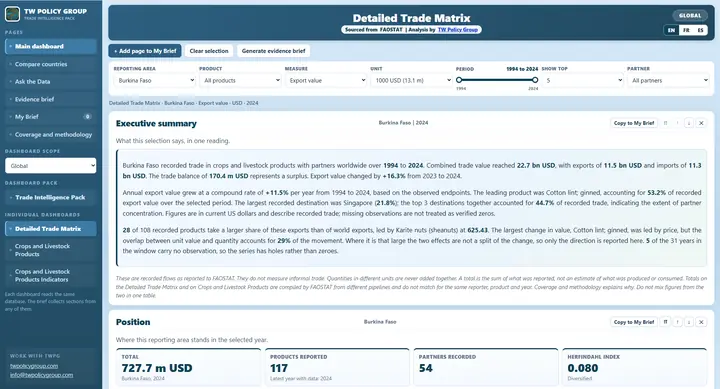
Trade Intelligence
Which markets and suppliers matter for a product, and how exposed is a country to them?
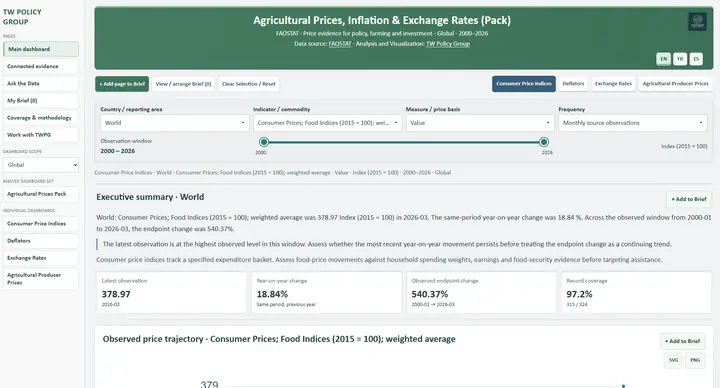
Prices, Inflation & Exchange Rates
How have producer prices, inflation and exchange rates moved, and what does that mean in real terms?
Bring us your production & food balances question.
We reply with the relevant evidence and a proportionate next step.