
Home / Methodology & Data Sources
Methodology and data sourcesTransparent evidence, from source to brief.
We use established official statistics. What we add is selection for a defined question, checked calculations, interpretation and a reproducible record.
Our approach
Official sources
FAOSTAT, FAO FishStat, OECD CRS and ILOSTAT, with source and version recorded on every page.
Preserved definitions
Flags, units and classifications kept as published. Missing values stay missing, never zero.
Checked calculations
Derived measures show their formula, denominator and observation years.
Stated limitations
Every brief ends with a methods annex listing coverage, breaks and caveats.
Evidence levels
We label what kind of statement each finding is.
Recorded
Source observations as published.
Derived
Checked calculations such as shares, growth rates and balances.
Modelled
Only from a validated model with stated uncertainty. None is offered today.
Interpretation
A reasoned reading, not a causal claim.
Sources by platform
Where each platform's data comes from.
| Platform | Source | Years | Coverage |
|---|---|---|---|
| Production & Food Balances | FAOSTAT Production (QCL), Value of Production (QV), Food Balances (FBS) | 1961 to 2024 | 209 countries and territories, 175 commodities; global and five regional editions |
| Population & Employment | FAOSTAT, ILO modelled estimates | 1991 to 2025, by series | Global, country level |
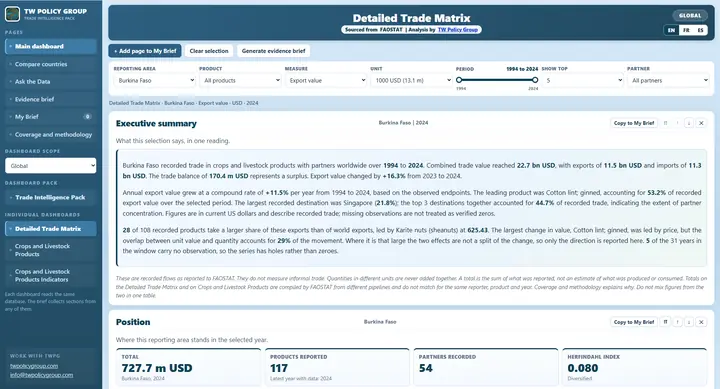
| Trade Intelligence | FAOSTAT Detailed Trade Matrix (TM), Crops and Livestock Products trade (TCL) | Bilateral flows to 2024; start year varies by reporter | Global, with five regional editions |
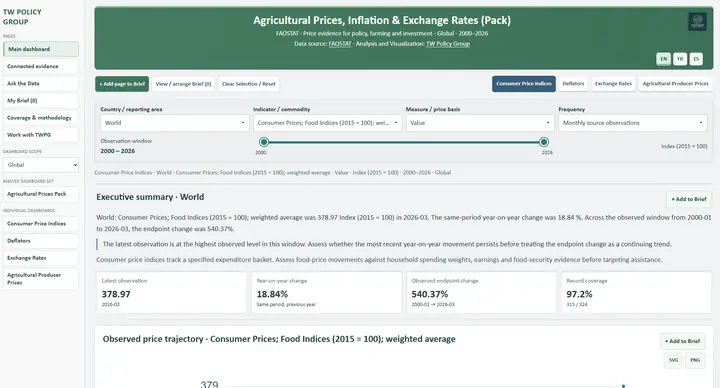
| Prices, Inflation & Exchange Rates | FAOSTAT Prices (CP, PP), Deflators (PD), Exchange Rates (PE) | 2000 to 2026, by series | Global, country level |
| Agricultural Finance & Investment | FAOSTAT Investment and Development Flows to Agriculture | 2001 to 2024 | Global, country level |
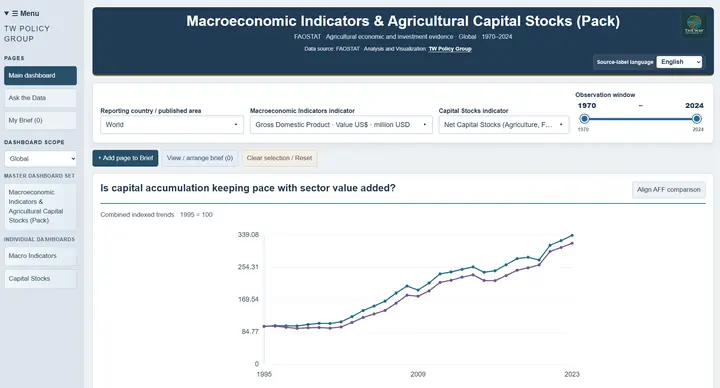
| Macroeconomic Indicators & Capital Stocks | FAOSTAT Macro Indicators (MK), Capital Stock (CS) | 1970 to 2024; capital stock 1995 to 2023 | Global, country level |
| Aid for Trade ODA | OECD Creditor Reporting System (CRS), project level | 2002 to 2024 | Global, by recipient and donor |
| Agriculture, Forestry & Fishing ODA | OECD Creditor Reporting System (CRS), project level | 1995 to 2024 | Global, by recipient and donor |
| Fisheries & Aquaculture Production | FAO FishStat | 1950 to 2024 | Global, all ASFIS species, environments and fishing areas |
| Aquatic Trade & Market Access | FAO FishStat trade, border rejection records | 1976 to 2024 · partners 2019 to 2024 · rejections 2016 to 2025 | Global |
| Fisheries Employment & Livelihoods | FAO FishStat employment and production | 1995 to 2024 | Global, country level |
How we fit with other tools
When an official tool is the better choice, we say so.
| ITC Trade Map | Detailed trade statistics by product and partner. We relate a trade question to production, employment and financing evidence for the same country. |
|---|---|
| ITC Market Access Map | Tariffs, quotas and non-tariff measures. For tariff lookups we point you there and prepare the market screen around it. |
| EU Access2Markets | Official EU rules of origin, requirements and formalities, which always need current verification there. We organise the research brief. |
| FAO Country Profile | Country charts across many FAO domains. We add a client-defined question, an evidence appendix and supported interpretation. |
| EUMOFA and RASFF | EU fisheries market data and food safety notifications. We add source-country production, workforce and financing context. |