We will help you extract and visualize actionable insights from your data through interactive dashboards, addressing your analytics needs swiftly and effectively.
Why Choose THE WAY POLICY GROUP as Your Power BI Consultant
- Over 6 years of proven success in data analysis and visualization.
- Microsoft and Power BI certified
- Experience delivering tailored dashboards and reports for SMEs, governments, and multilateral organizations.
- Expertise across multiple sectors including trade policy and sustainable development.
- Quick implementation for immediate insights and agile adaptation.
Industries
Data visualization use cases
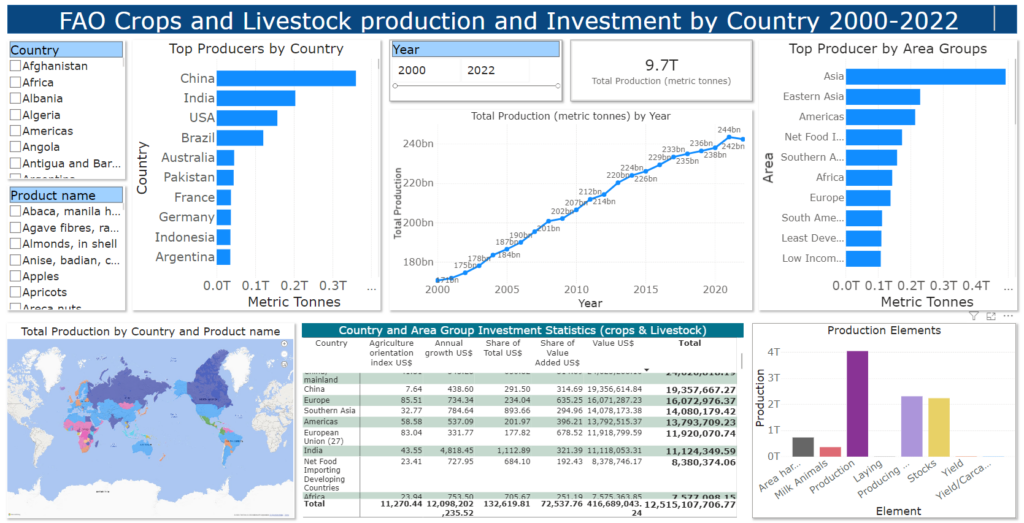
In the field of international trade, data visualization simplifies complex datasets such as trade flows, import/export trends, tariff impacts, and market performance. By converting this information into easy-to-understand graphics, it enables stakeholders to identify opportunities, analyze risks, and make informed decisions. Data visualization empowers businesses, NGO's, and trade professional to navigate global markets effectively, even without advanced data analysis expertise.
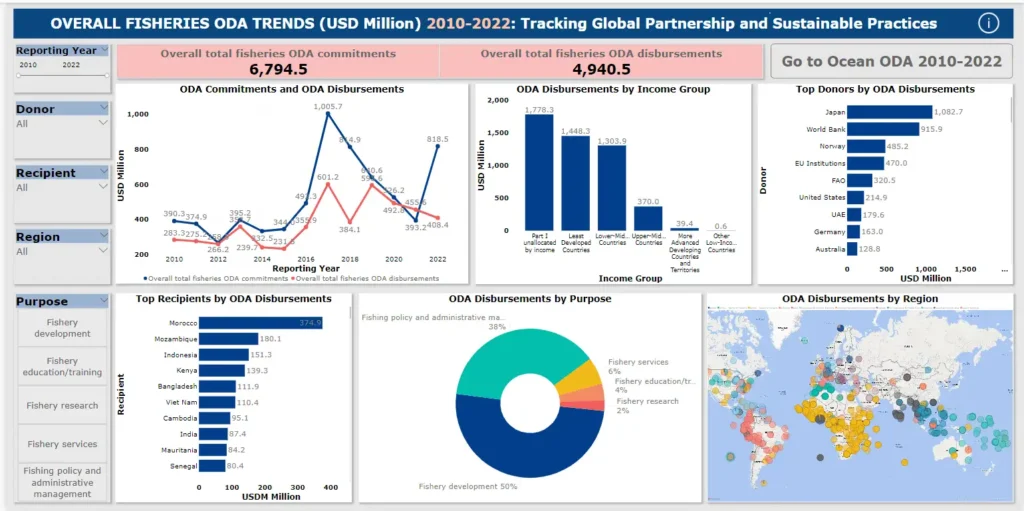
Data visualization in development finance simplifies datasets like OECD Creditor Reporting System data, donor priorities, sector allocations, green finance, and sustainable development metrics. It helps stakeholders track investments, evaluate outcomes, and align resources with key development goals.
Data visualization helps small businesses and retailers make sense of sales trends, customer behavior, inventory, and market performance. By presenting key metrics in an easy-to-understand format, it supports better decision-making, drives growth, and improve efficiency.
Data visualization enables manufacturers to monitor production metrics, optimize supply chains, and track equipment performance. By presenting complex data in a clear format, it helps identify inefficiencies, reduce downtime, and improve overall operational efficiency.
Data visualization helps agribusinesses track crop yields, monitor supply chains, and analyze market trends. It simplifies complex data, enabling better resource allocation, improving efficiency, and supporting sustainable agricultural practices.
Data visualization enhances project management by tracking timelines, resource allocation, and task progress in real time. It provides clear insights into project performance, identifies bottlenecks, and ensures teams stay aligned with goals and deadlines.
Services
Data visualization services we offer
Customized dashboards
Identify your organization's goals, and apply the most effective data visualization techniques for your business. Our expert consultants will assist you in optimizing workflows and improving your understanding of your data, providing real-time insights into business trends and processes. Customized dashboards offer a centralized, real-time view of operations, helping businesses track key metrics and uncover valuable insights. By leveraging tailored dashboards, businesses can make faster, data-driven decisions and maintain a competitive edge in today's dynamic environment.
Transform Your Data Analytics
With THE WAY Policy Group!
Software stack
Data visualization tools
The data visualization tools we use are:

Microsoft Power BI
A dynamic business analytics platform designed to deliver interactive visualizations and advanced intelligence tools. It seamlessly integrates data from various sources to create insightful dashboards, detailed reports, and powerful analytics for informed decision-making.

Python
A versatile and powerful programming language widely used for data visualization and analysis. Leveraging libraries like Matplotlib, Seaborn, and Plotly, Python creates customized, interactive visuals and transforms complex datasets into actionable insights tailored to specific business needs.
SPSS
A robust statistical analysis tool that simplifies complex data manipulation and visualization. With its user-friendly interface and advanced analytics capabilities, SPSS transforms data into comprehensive charts, graphs, and predictive models, enabling evidence-based decision-making and insights.
Microsoft Excel
A versatile data analysis and visualization tool that enables users to organize, analyze, and present data through dynamic charts, pivot tables, and graphs. Its intuitive interface and powerful functions make it ideal for creating detailed, actionable insights from raw data.
Projects
Featured projects
F.A.Q. about data visualization
Data visualization is the process of transforming complex data sets into clear, concise, and easily understandable visual representations.
You don’t have to build data visualizations from scratch. You can quickly leverage a platform’s capabilities to automate the reporting process and prepare data using the platform’s data preparation tools. For small and mid-sized businesses, customizing a platform to fit your needs is usually easier and less expensive than building from scratch. Considering the limitations of the platform and the size and requirements of your business, we can help you choose the best solution.
As your organization grows, the amount of data it produces increases, making it difficult to find a platform that fully meets your business needs. With custom solutions, your enterprise can standardize its requirements and present complex data sets using advanced analytics and more sophisticated business logic. With our custom solutions, you can integrate new business processes and measure the results of their implementation in near real time.
The potential pitfalls of data visualization can hinder the effectiveness of the visual representation. Some of the challenges that can occur include:
Utilizing the wrong visualization format. Applying the wrong format can result in confusion and misunderstanding. For example, using a spider chart when comparing only one characteristic can be unclear, while applying a line graph to compare multidimensional units can be overwhelming.
Using the wrong type of data. It is essential to understand what type of data can be applied to your chosen data visualization tool. Choosing the wrong type of data can lead to inaccurate representations, causing misinterpretation of the data.
Choosing inappropriate tooling. Selecting a vendor with the wrong capabilities or tools can lead to limitations on the amount of data that can be processed, the frequency of updates, and visualization capabilities.
To avoid these pitfalls, it’s crucial to work with a qualified data visualization specialist who can help navigate the complexities of the data and select the correct visualization format, data types, and tools.
STILL HAVE QUESTIONS?
Can’t find the answer you are looking for? Contact us and we will get in touch with you shortly.

