Interactive products on trade flows, production, employment, fertilizer, fisheries, and ODA, built for ministries, investors, agribusinesses, and development partners across Africa and emerging markets.
Every product in the catalogue has its own page with full data scope, methodology, and licensing options. Three access modes apply across the catalogue, mapped to the same six-license commercial menu we use on the Services page.
Fully interactive on the product page. No login required. Explore directly.
Free PreviewSingle User or Team licenses for analysts, agribusinesses, NGOs, and research institutes. Self-service checkout.
Single User · TeamEmbed, White-Label, or Regional licensing for ministries, multilaterals, and platform partners. Procurement-ready contracting.
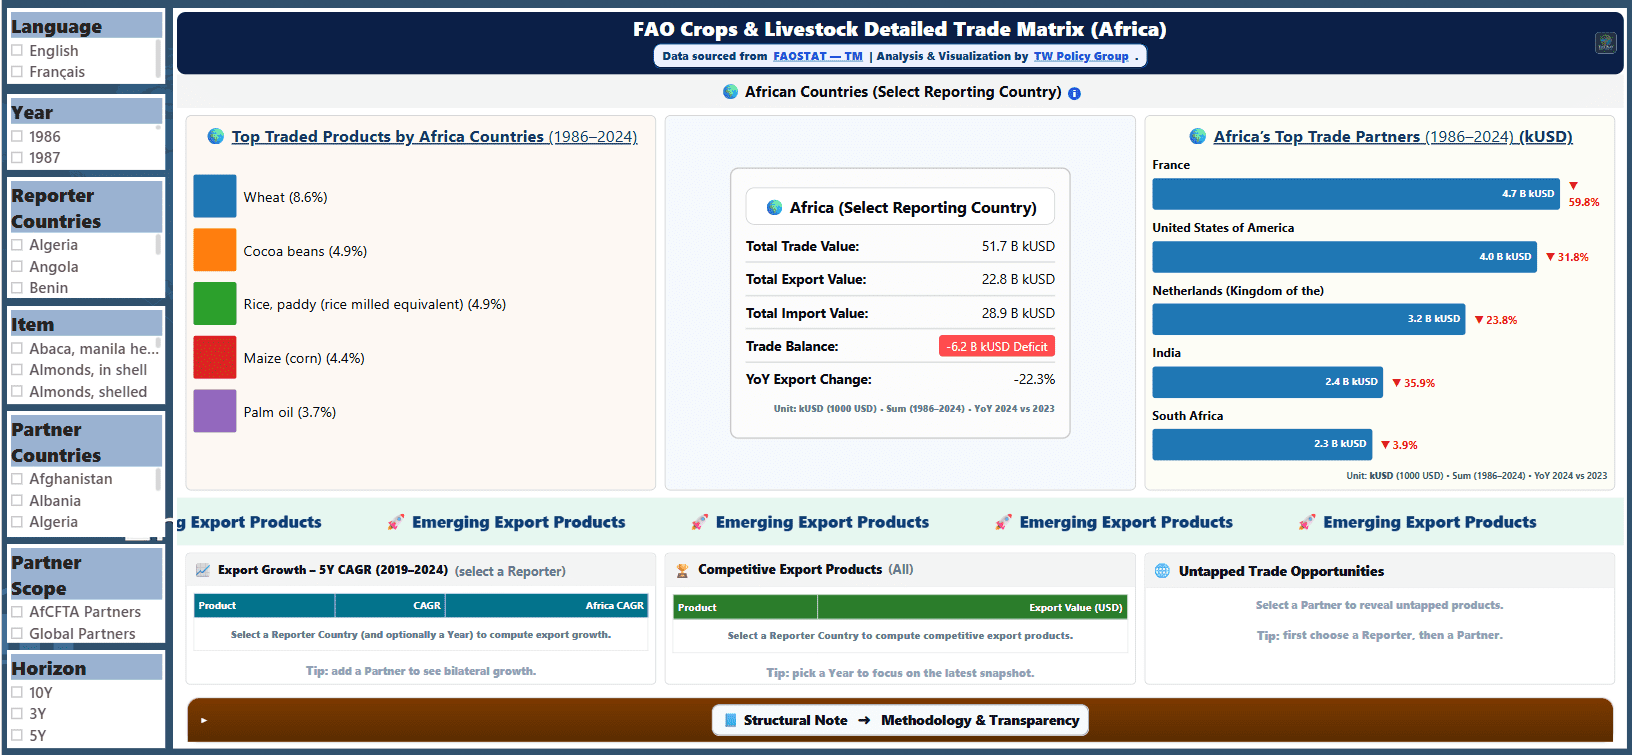
Embed · White-Label · Regional1986–2024 · Crops & livestock trade flows across African countries. Comparative market intelligence for export strategy and AfCFTA analysis.
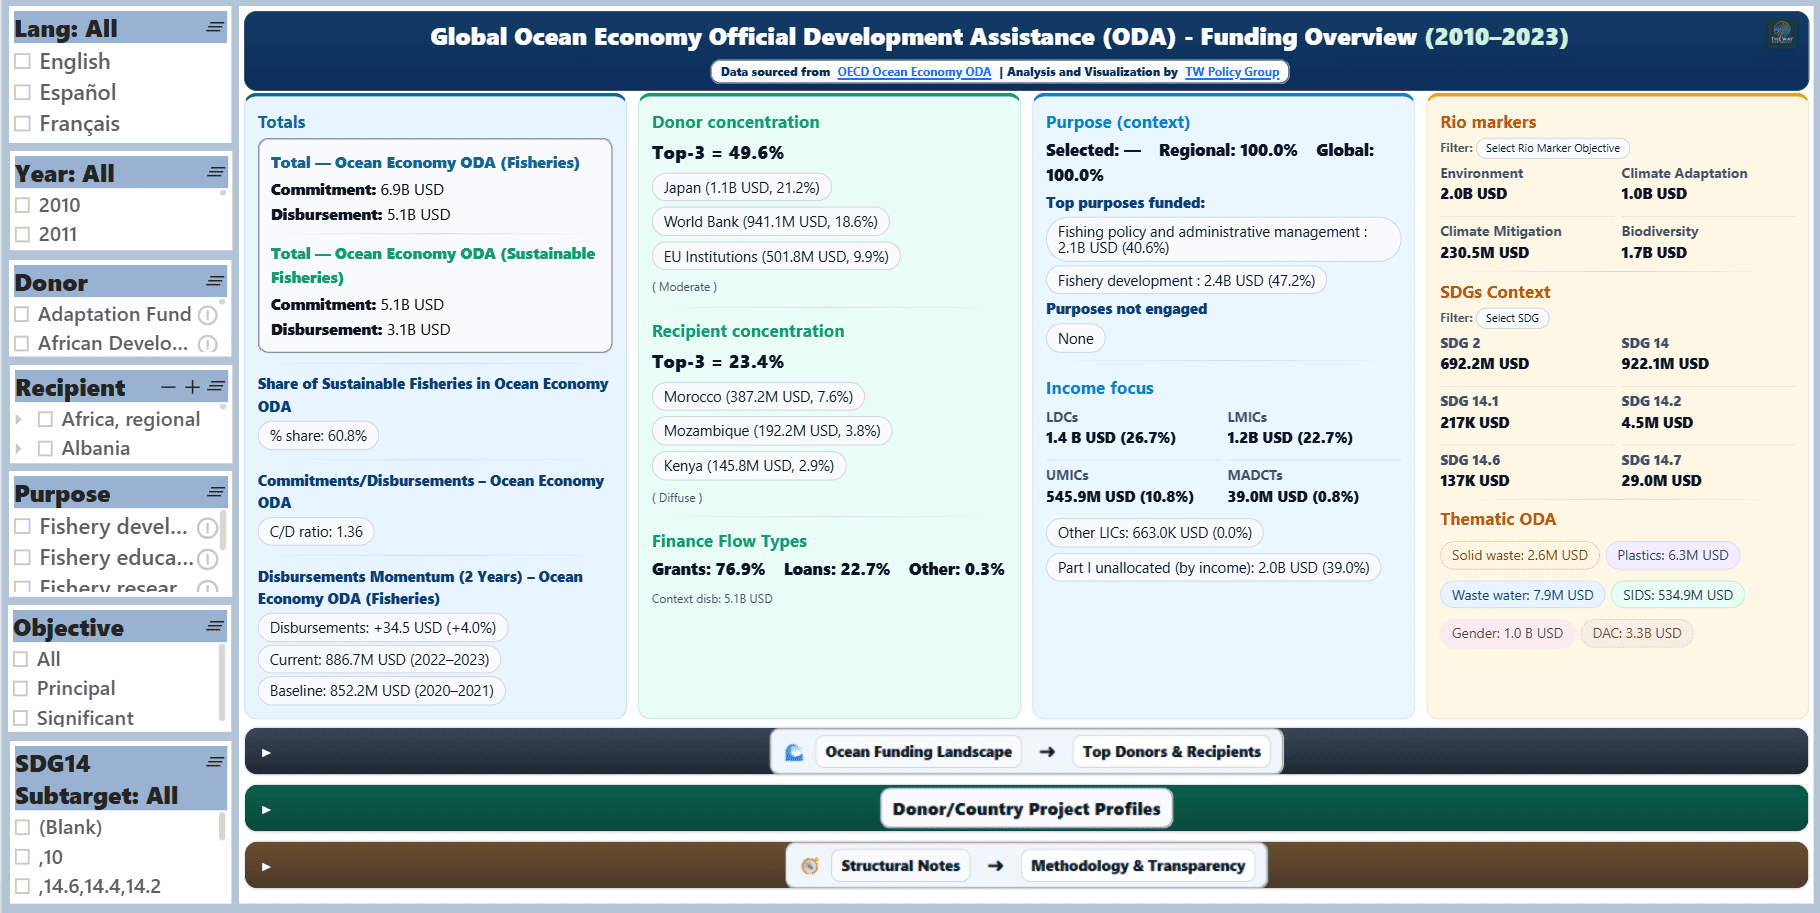
2010–2023 · Sustainable fisheries and blue economy financing. Donor and recipient tracking across commitments, disbursements, and project themes.
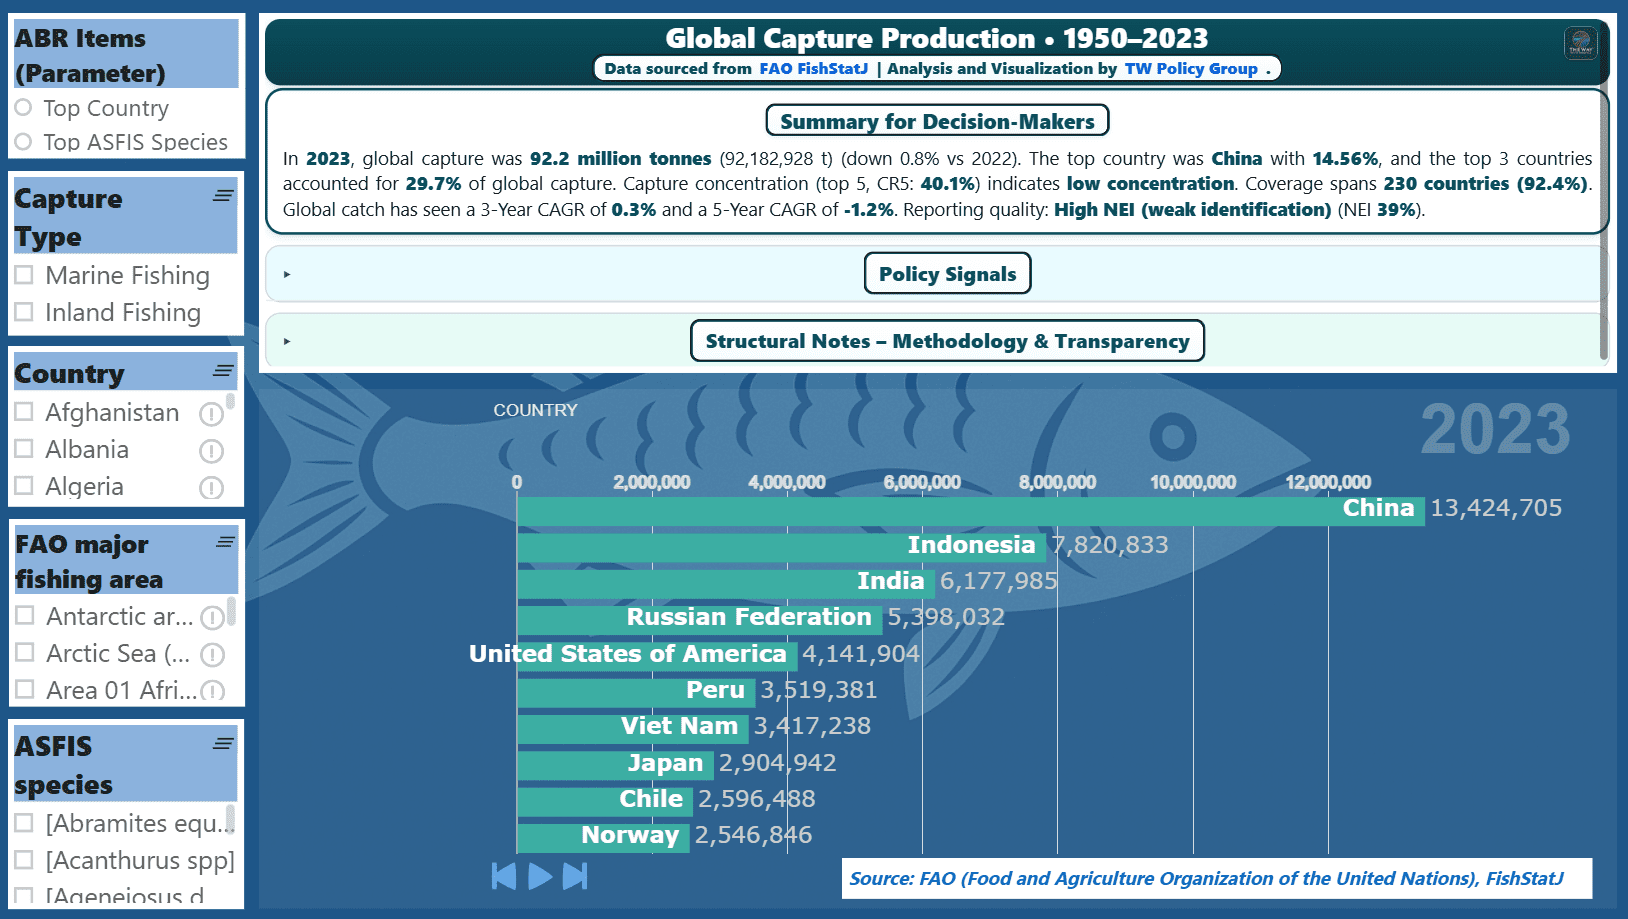
1950–2023 · Marine and inland capture production trends across species, countries, and fishing areas. Long-run sustainability and sector diagnostics.
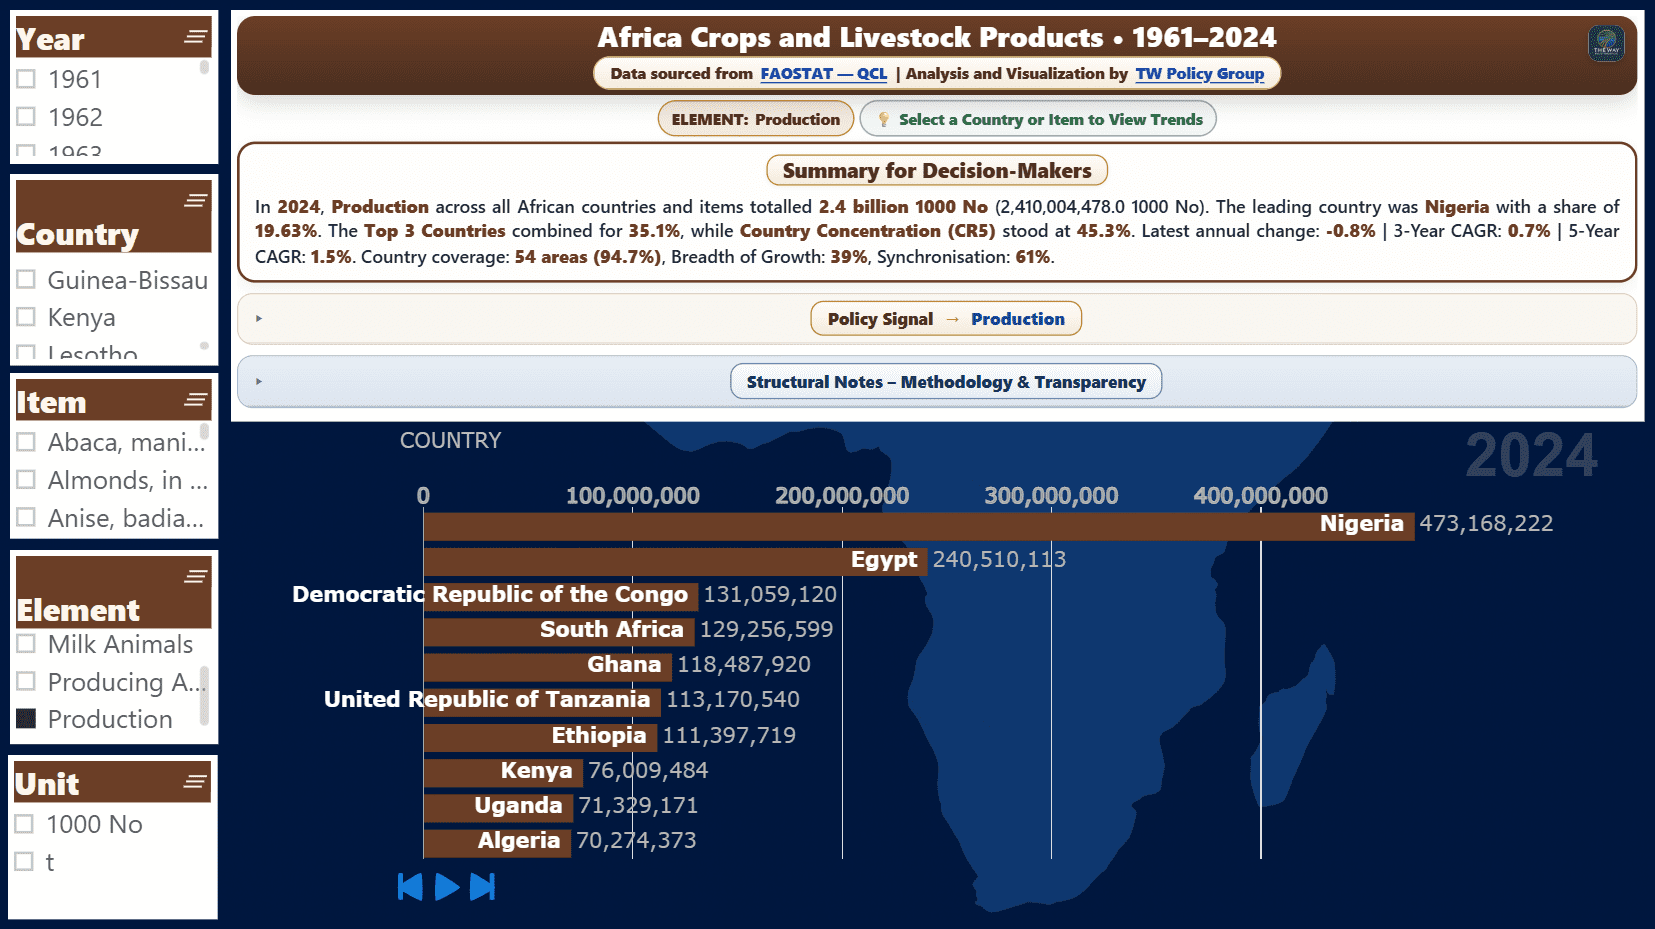
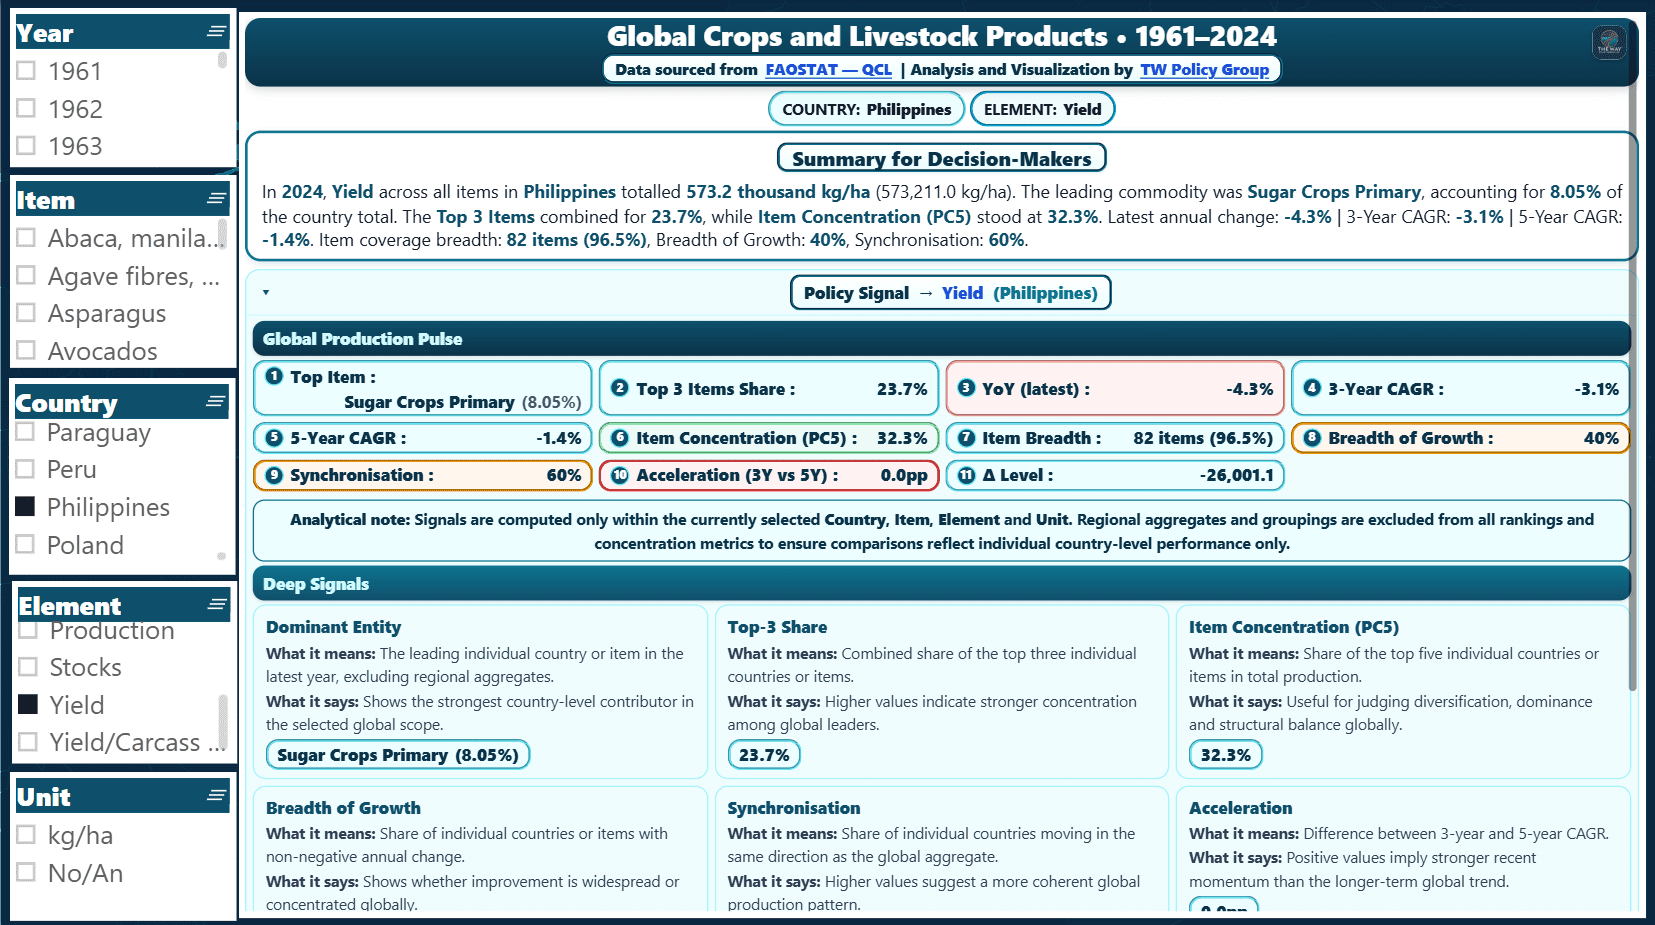
1961–2023 · Long-run production intelligence across African countries and commodities. Yields, structural shifts, and comparative country performance.
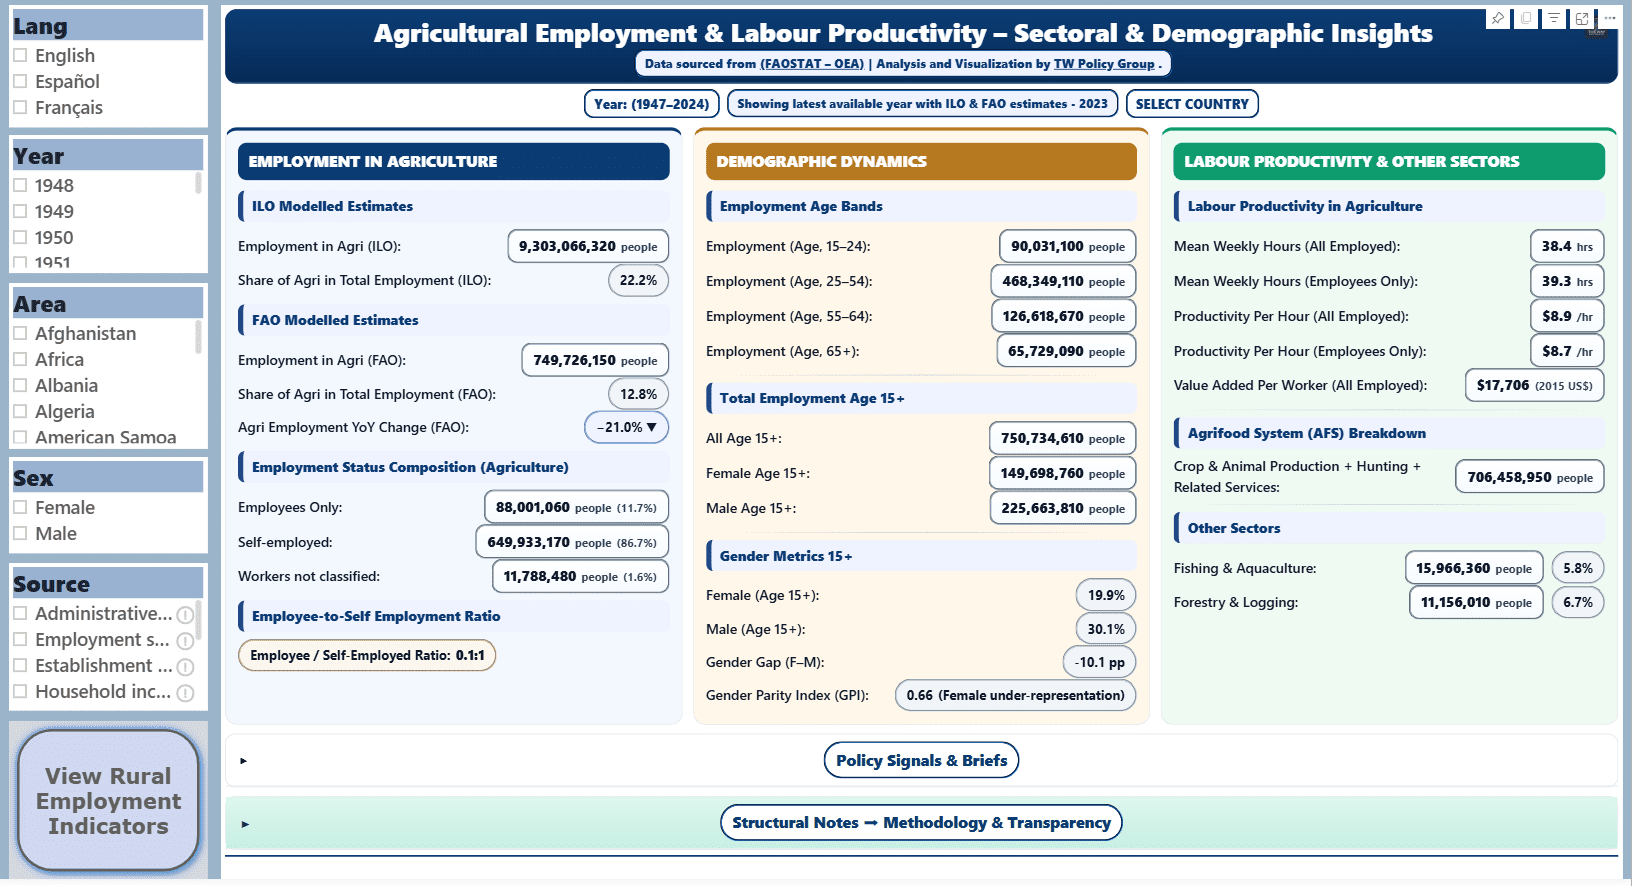
1947–2024 · Rural employment and labor market structure in agriculture. Workforce composition, gender breakdowns, and productivity trends.
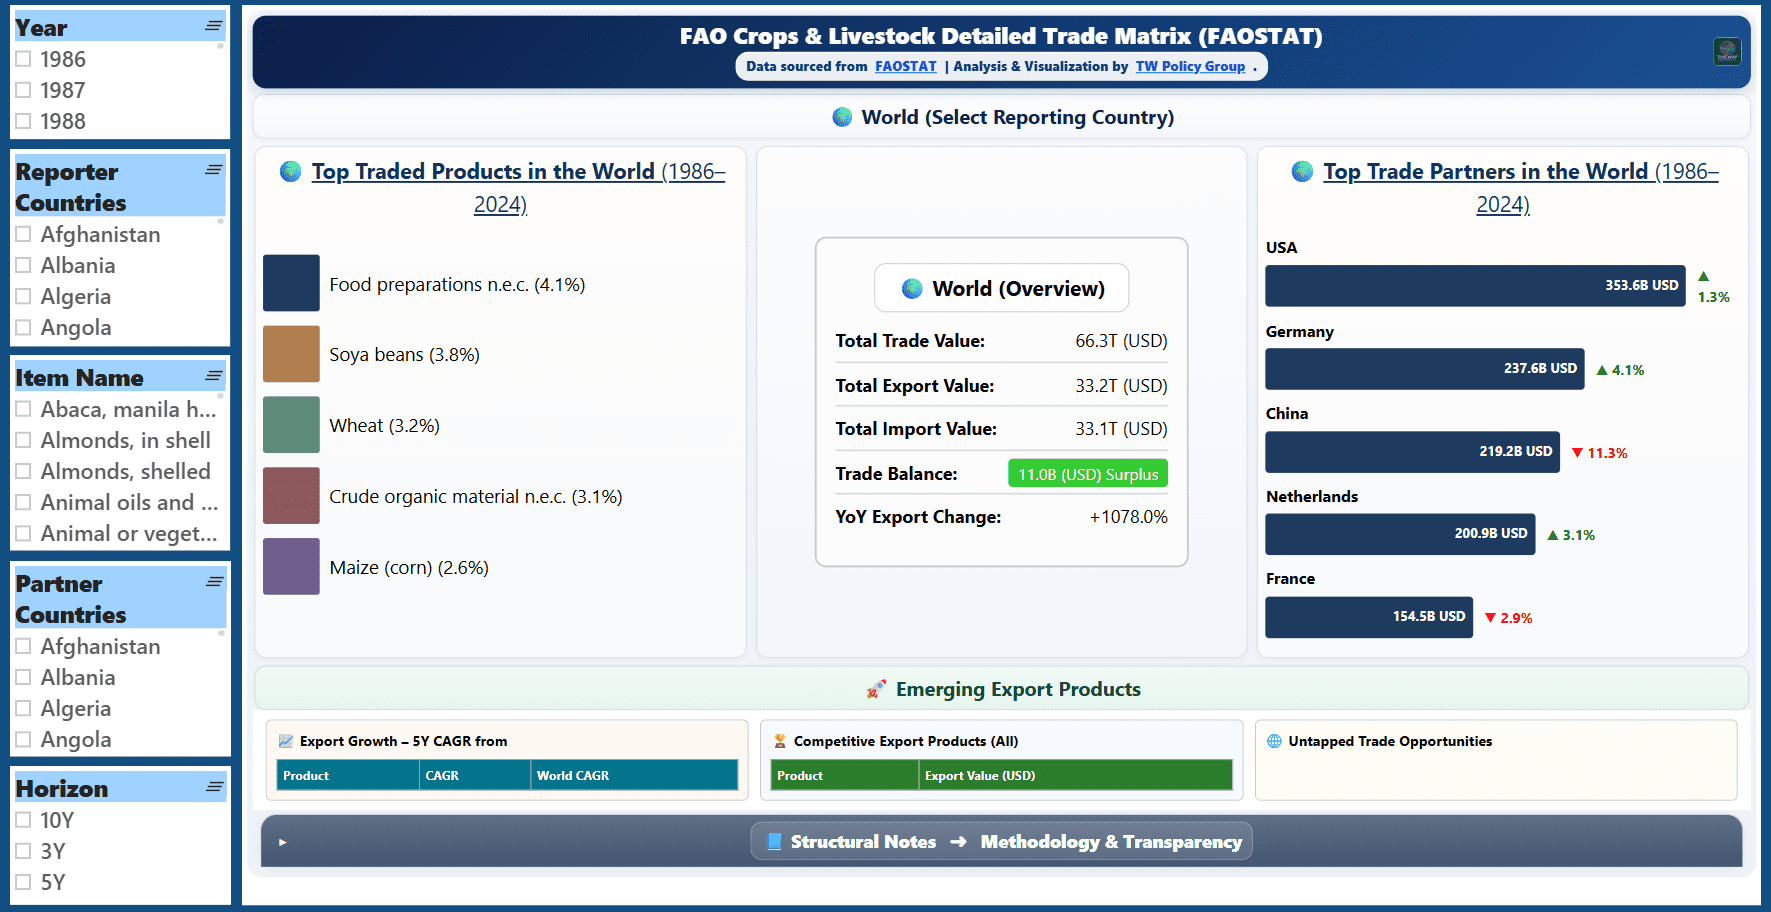
1986–2024 · Worldwide crops and livestock trade flows, partner dynamics, and product-level intelligence. Cross-region benchmarking and market sizing.
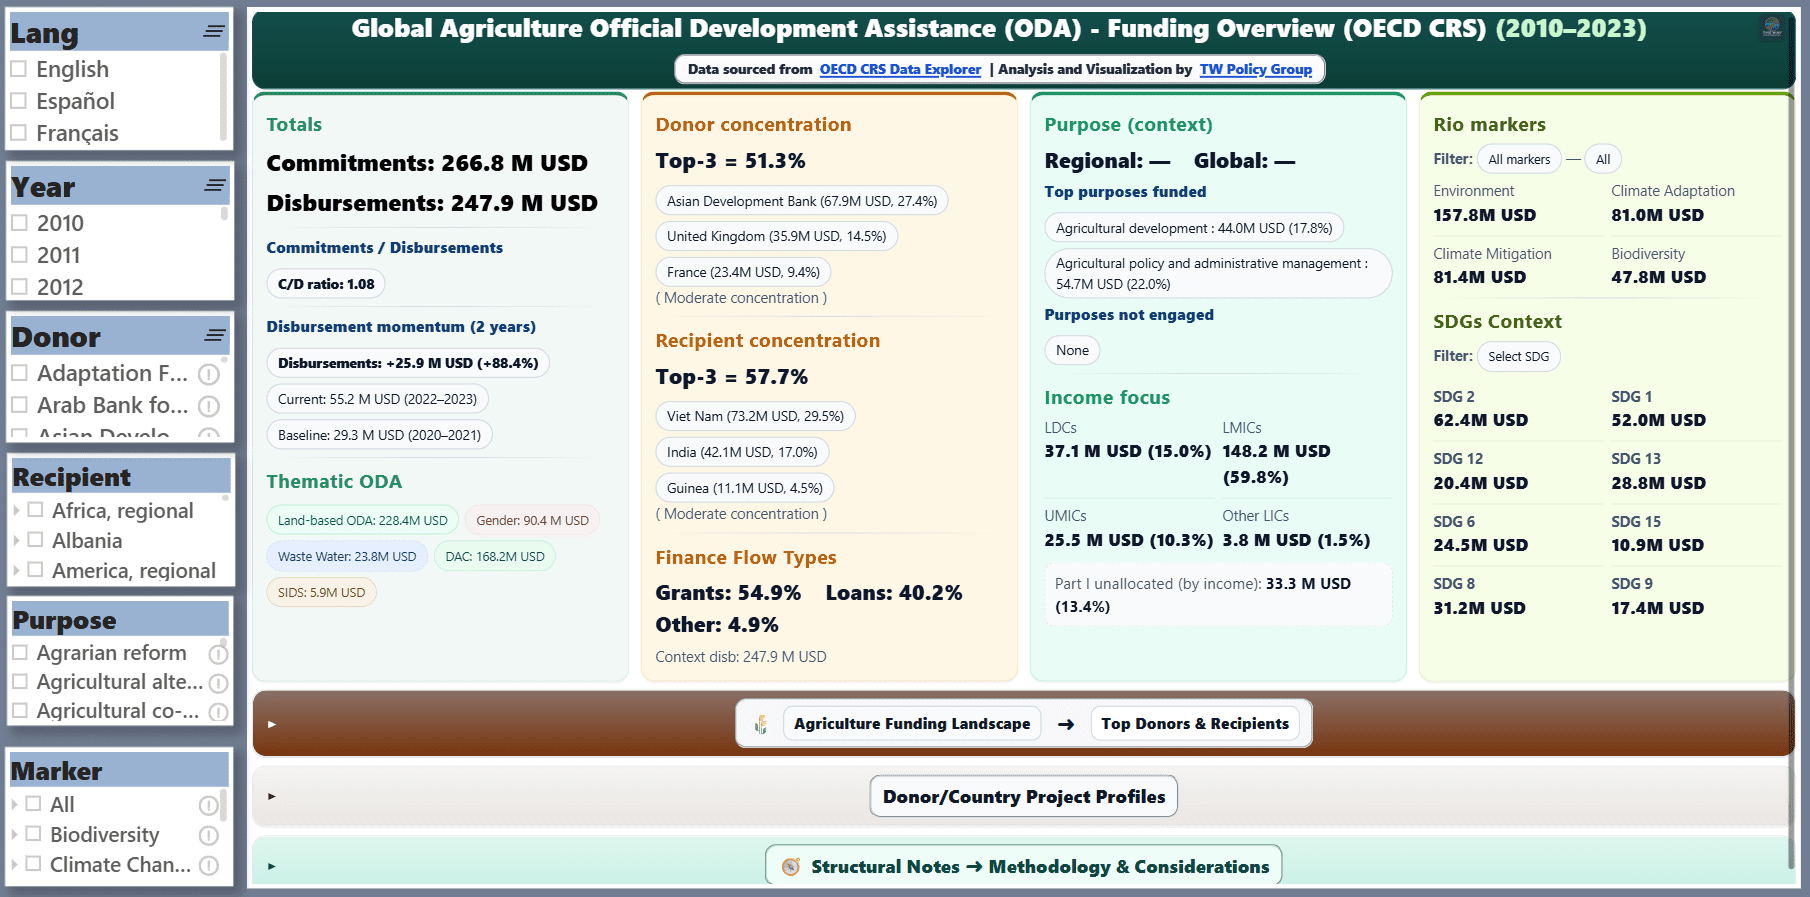
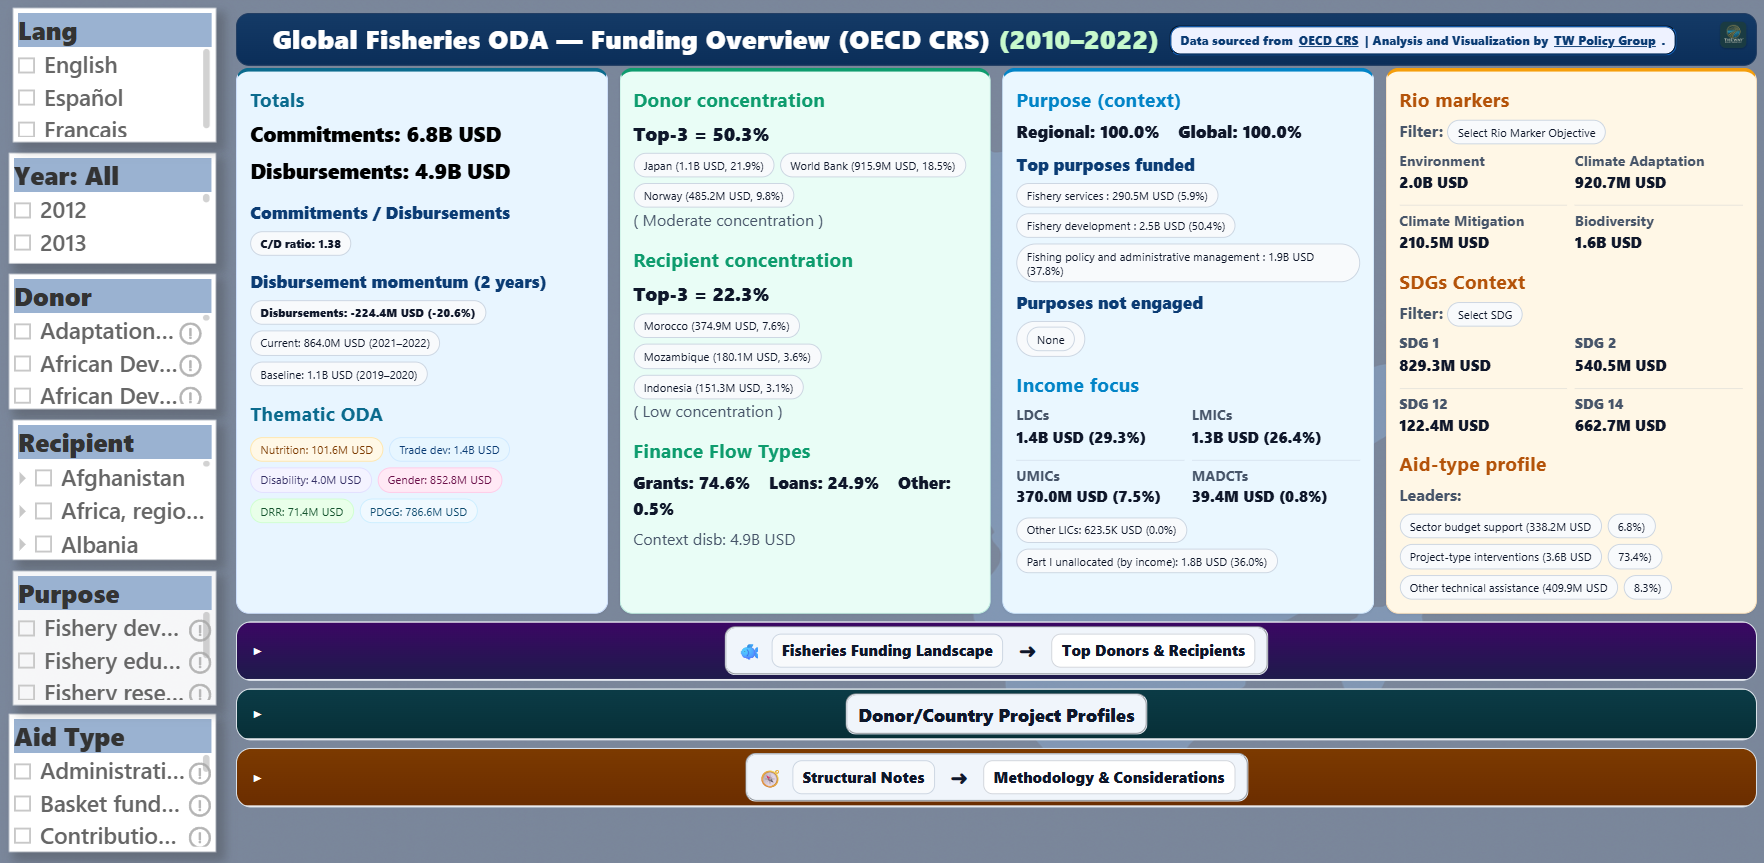
2010–2023 · ODA trends, commitments, disbursements, and partner mapping. Donor concentration, recipient priorities, and Rio Marker analytics.
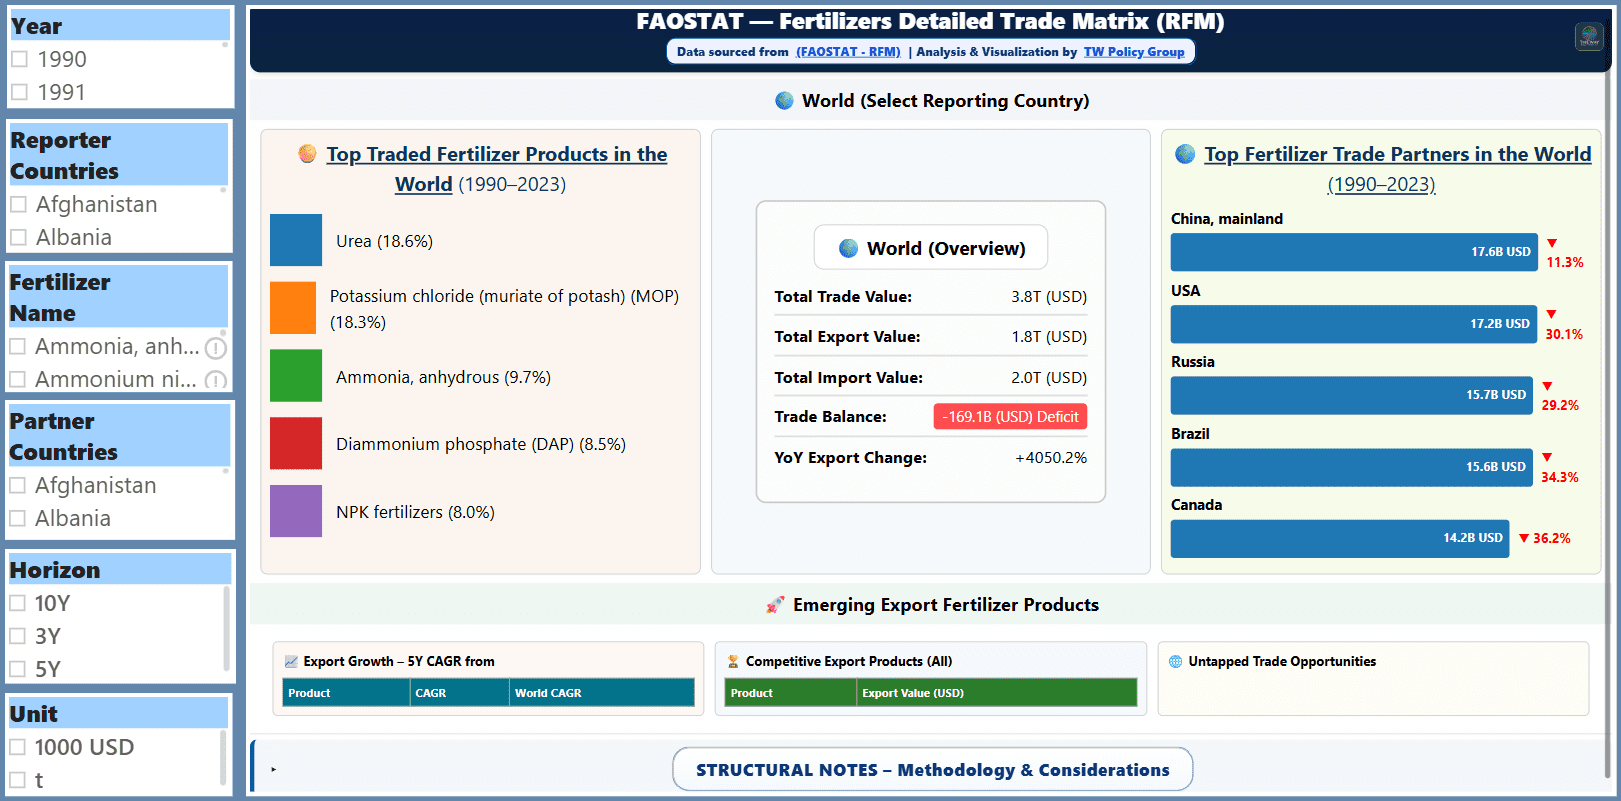
1990–2023 · Urea, phosphate, and potash trade flows. Partner dependencies, supply chain mapping, and input security diagnostics.
1961–2024 · Long-run global production intelligence across countries, products, yield elements, and structural trends.
2010–2022 · Fisheries ODA overview covering donors, recipients, projects, commitments, and disbursements across the global portfolio.
Embed, white-label, or regionally license TWPG analytical products for your ministry, multilateral, sector platform, or continental program. Procurement-ready contracting with optional advisory hours bundled.
Three audiences, three procurement realities. Every product in the catalogue supports all three.
Independent analysts, academics, solo consultants. Self-service Single User license, fast access.
Agribusinesses, exporters, research institutes, NGOs. Team licenses with shared workspaces and quarterly briefings.
Ministries, multilaterals, DFIs, regional bodies. Embed, White-Label, and Regional licensing with procurement-ready contracting.
Pick a product, explore the preview, choose the license that fits. Single User and Team licenses self-serve through checkout. Embed, White-Label, and Regional licenses route to our sales team for procurement-ready contracting.