Global Crops & Livestock Products Dashboard
FAOSTAT QCL data Platform (1961 to 2024)

A decision ready dashboard built on FAOSTAT QCL data by TW Policy Group to support agricultural investment, food security planning and import substitution strategies with integrated global production evidence. It tracks crops and livestock output, harvested area, yield, and stocks across 217 countries, with live rankings, long run trends and policy signals.

217+Countries / Territoriesglobal coverage
273Productscrop & livestock items
63+ yrsTime Horizon1961 to 2024
8Elementsproduction, yield, stocks, animals
7Unitstonnes, ha, kg/ha, head & more
3LanguagesEN · FR · ES

What decisions can this dashboard help you make?

Investors

  • Identify high growth agricultural sectors
  • Compare production performance across countries
  • Support investment due diligence

Governments

  • Monitor food security trends
  • Benchmark national production performance
  • Prioritize agricultural interventions

Agribusiness

  • Evaluate sourcing markets
  • Monitor supply risks
  • Identify production opportunities
🔎 Filter by Country / Territory Item / Product Element Unit Year Top Rankings Signals
Free preview

Global Crops & Livestock Products · Interactive Dashboard Explore the public preview, then unlock the complete global dashboard, full historical coverage, live rankings and policy signals.

Unlock full dashboards →
01 / 12
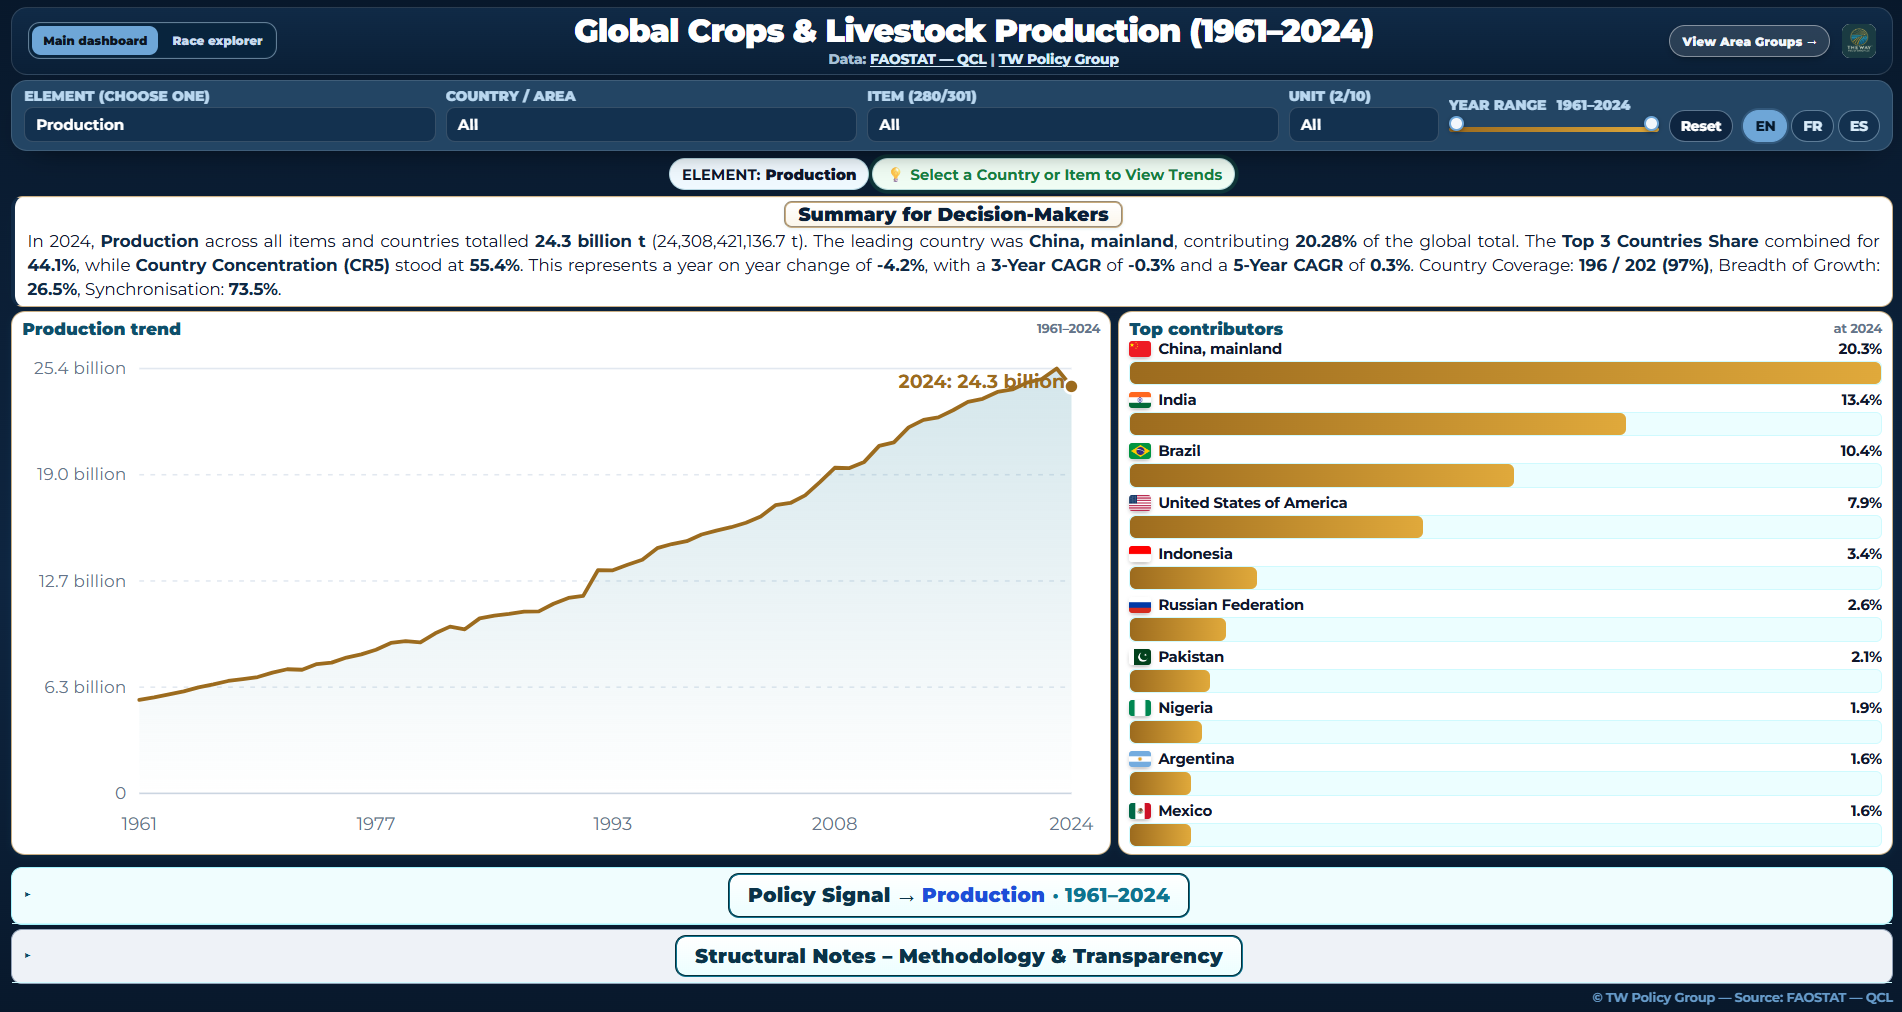
📈 Production overview · global scale

Read output scale, leadership and momentum together

The production view brings totals, country rankings, product structure and historical movement into one coordinated screen for fast global benchmarking.

  • Identify the largest producers within the selected scope.
  • Compare current scale with long-run movement.
  • Use the combined view for executive production briefings.

Everything included in your access

Every language version contains the full dashboard. Here is exactly what you can do with it.

Two interactive pages. The Overview page carries the Summary for Decision-Makers, Policy Signals and the animated bar race. Trend Explorer carries the KPI strip, long run trend line, Top 10 leaderboard and composition donut.
Decision maker summary. A plain language brief that writes itself for any country, item, element and year you select.
Policy Signal panel. 11 live signals: top producer, Top 3 share, CR5 / PC5 concentration, YoY, 3 and 5 year CAGR, breadth of growth, synchronisation, acceleration and level change.
Rankings and composition. Top 10 country leaderboards plus a product composition donut for the selected scope.
Long run trend lines. Full 1961 to 2024 series with a 5 year moving average to read momentum cleanly.
8 elements across 7 units. Production, area harvested, yield, stocks, producing and slaughtered animals, milk and laying counts, each kept in its correct unit.
Global depth. 217 countries and territories, 273 crop and livestock products, more than six decades of history.
Five way filtering. Slice instantly by Year, Item, Country, Element and Unit to isolate exactly what you need.
Methodology and transparency. Built in structural notes, interpretation bands and the formulas behind every signal.
Briefing ready. Clean, presentation grade views for ministers, boards, investors and donor partners.
Annual refresh included. Your 12 months of access covers the next FAOSTAT data refresh integrated into the model.
Your language. Identical capability in English, French or Spanish, or take all three.
Two ways to work with this data

Choose your path

Subscribe to the live dashboard for ongoing analysis, or order a single ready to brief report for one decision. Same FAOSTAT engine behind both.

Interactive Dashboard

A live, interactive dashboard your team uses all year. Filter anything across 217 countries and 273 products and read it instantly.

  • Explore every country, product and element yourself
  • Production Pulse & Deep Signals, live
  • Annual data refresh included

From $999/year

See platform plans

Intelligence Reports

A polished, point in time document for one country, sector or commodity. One time purchase, delivered to your inbox. No subscription.

  • Executive summary, charts & animated rankings
  • From a quick snapshot to a national flagship report
  • Delivered as PDF & PowerPoint

From $149 one time

See report options
Platform · Annual subscriptions

Global Crops & Livestock Dashboard Plans

Choose the level of production intelligence your organisation needs: complete global analysis, global Area Group benchmarking, or one integrated institutional suite combining global, Area Group and regional dashboards.

Global access

Global Crops & Livestock Products Dashboard

Continuous access to global crops and livestock production intelligence covering countries, commodities and production indicators through one multilingual analytical platform.

$999

per year

  • Complete Global Crops & Livestock Products Dashboard
  • Full historical database from 1961 to 2024
  • Global country, commodity and production-indicator coverage
  • Production Overview and Trend Explorer
  • Executive summaries, Production Pulse and Deep Signals
  • Automated Policy Signals and historical rankings
  • Interactive filtering, comparisons and exportable visualisations
  • Multilingual interface: English, French and Spanish
  • Continuous data and platform updates
  • Unlimited dashboard access and email support

Best for: Government ministries • Development organisations • Researchers • Universities • Consultants • Investors • Global agribusinesses

Global benchmarking

Global Crops & Livestock Benchmarking Suite

Benchmark global agricultural production across FAOSTAT regions, sub-regions, economic groups and internationally recognised development classifications.

$1,399

per year

  • Everything in the Global Production Dashboard
  • 33 FAOSTAT Area Group dashboards
  • Continental and sub-regional comparisons
  • Development and economic group benchmarking
  • LDCs, LLDCs, SIDS, LIFDCs, NFIDCs, EU-27 and more
  • Cross-region production trends and comparative rankings
  • Competitiveness, concentration and structural performance analysis
  • Executive summaries and automated Policy Signals
  • Multilingual platform with continuous updates

Best for: International organisations • Development banks • Government institutions • Policy analysts • Investors • Universities • Multinational agribusinesses

Complete institutional suite

Global Crops & Livestock Complete Dashboard Suite

The complete production intelligence environment: the Global Dashboard, all FAOSTAT Area Group benchmarks and all five regional dashboards embedded within one integrated dashboard suite.

$2,999

per year

  • Everything in the Global Benchmarking Suite
  • Complete Global Crops & Livestock Products Dashboard
  • All 33 FAOSTAT Area Group dashboards
  • Africa Crops & Livestock Production Dashboard
  • Americas Crops & Livestock Production Dashboard
  • Asia Crops & Livestock Production Dashboard
  • Europe Crops & Livestock Production Dashboard
  • Oceania Crops & Livestock Production Dashboard
  • Integrated global-to-regional benchmarking workflow
  • Cross-market, cross-region and development-group comparisons
  • Executive summaries, Policy Signals and comparative intelligence
  • Multilingual access, continuous updates and priority email support

Best for: Government ministries • UN and international organisations • Development banks • Regional institutions • Global investors • Multinational agribusinesses • Enterprise research teams

ℹ️
Annual platform access. Each subscription includes one licensed user, continuous platform updates and email support. The Complete Dashboard Suite provides the broadest institutional benchmarking capability by combining global, Area Group and regional production intelligence in one environment. Need institutional invoicing, procurement documentation or multiple licences? Contact TW Policy Group.
Reports · One-time purchase

Country & National Intelligence Reports

Executive-ready reports prepared from the same FAOSTAT production intelligence framework that powers the dashboard. Select the depth of analysis required for a rapid country briefing, a comprehensive country assessment or national agricultural strategy.

Country Snapshot

Rapid country intelligence and executive briefing

$149

one time

  • One country with a focused commodity or production theme
  • Full historical series from 1961 to 2024
  • Decision-Maker Summary and country production overview
  • Production Pulse, Deep Signals and automated Policy Signals
  • Historical trends, growth performance and country rankings
  • Executive charts and animated historical rankings
  • Strategic observations for policy, investment or market screening
  • Professional PDF report

Best for: Executive briefings • Business proposals • Rapid country assessments • Research and market screening

Order Country Snapshot · $149

Professional PDF report

Most popular

Country Deep Dive

Comprehensive country production and competitiveness assessment

$299

one time

  • One country across all relevant crops, livestock commodities and production indicators
  • Full historical series from 1961 to 2024
  • Executive Summary, Production Pulse and Deep Signals
  • Commodity, indicator and historical performance analysis
  • Production concentration, growth and structural trend analysis
  • Global competitor and country benchmarking
  • Import substitution, food security and investment opportunities
  • Automated Policy Signals and strategic recommendations
  • Professional PDF report and PowerPoint presentation

Best for: Government agencies • Development partners • Agribusinesses • Investors • Consulting and research institutions

Order Country Deep Dive · $299

PDF & PowerPoint

National Intelligence

Flagship national crops and livestock intelligence assessment

$599

one time

  • Complete national crops and livestock production portfolio
  • All relevant commodities, production indicators and historical series
  • Decision-Maker Summary and national agricultural production profile
  • Sector, commodity and structural performance assessments
  • Country, regional and global benchmarking
  • Food security, production resilience and import substitution analysis
  • Strategic agricultural investment priorities and opportunity mapping
  • Automated Policy Signals and evidence-based policy recommendations
  • Executive-ready charts, rankings and presentation graphics
  • Professional PDF report and PowerPoint presentation

Best for: Government ministries • Development banks • International organisations • National investment agencies • Major institutional investors

Order National Intelligence · $599

PDF & PowerPoint

ℹ️
How reports work. After checkout, confirm the country, analytical priorities, preferred language and any policy, investment or benchmarking questions. TW Policy Group prepares the report from the live FAOSTAT production intelligence model and delivers it by email. No dashboard subscription is required. Need a custom institutional scope?
Compare reports

Which report is right for you?

Move from a focused executive country briefing to a full country assessment or a national agricultural intelligence package.

Feature Country Snapshot Country Deep Dive National Intelligence
Primary scopeFocused country themeComplete country assessmentNational crops & livestock portfolio
Historical series (1961–2024)
Decision-Maker / Executive Summary
Production Pulse, Deep Signals & Policy Signals
Historical trends, rankings & executive charts
All relevant commodities and production indicatorsFocused scope
Growth, concentration & structural analysis
Country, regional & global benchmarking
Food security, resilience & import substitution
National sector profiles and portfolio synthesis
National investment priorities and policy recommendationsSelected recommendations
DeliveryPDFPDF + PowerPointPDF + PowerPoint
Price$149$299$599

Government & Development Partner Solutions

Bespoke, analyst-led analysis and dashboards built to an institution's exact mandate, from agricultural transformation strategies to food security and livestock development programs.

Ministries of Agriculture Development Banks UN Agencies Donor Programs Agribusinesses Commodity Boards

Typical engagements

Request a consultation
FAQ

Frequently asked questions

What data source do you use?
Everything is built on FAOSTAT, the FAO's global crops and livestock production data, harmonised into the TW Policy Group model.
Which countries are covered?
217 countries and territories worldwide.
What years are covered?
The full historical series, 1961 to 2024.
Which languages are available?
English, French and Spanish, for both the dashboard and the reports.
How long does report delivery take?
Typically 24 to 72 hours after you confirm your report specifics.
What format do I receive?
Reports are delivered as both PDF and PowerPoint.
Can I request a custom country?
Yes. Any of the 217 covered countries can be selected for any report tier.
Can ministries request bespoke reports?
Yes. Our Government & Development Partner Solutions cover fully bespoke, analyst led engagements scoped to your mandate.
Do I need a dashboard subscription to buy reports?
No. Reports are a standalone one time purchase, with no subscription or account required.
Can reports be updated annually?
Yes. As FAOSTAT releases new data each year, reports can be refreshed on request.
Can reports be branded for institutions?
Available on request for institutional and partner engagements.

Ready to turn agricultural data into practical decisions?

Choose your path

Subscribe to the Interactive Dashboard

Get dashboard access

Order a Country Intelligence Report

Order a report

Discuss a Government Solution

Contact our team

What you can do with it

Benchmark any country

See how an economy performs against the world distribution, surfacing leaders, emerging producers and overlooked mid tier performers, then frame export, trade and transformation strategy on the evidence.

Read momentum, not just totals

The policy signal layer translates raw numbers into interpretation, concentration, dominance, growth and structural shifts, so the story is on the same screen as the data.

Go beyond output volume

Compare production, area and yield within the correct unit to judge productivity and competitiveness, not just size, the difference that drives real policy and investment calls.

Track a single commodity

Follow how one product such as avocado, maize, palm oil, cocoa or milk evolves across producers and time, for commodity analysis and import substitution planning.

Brief decision makers

Clean, presentation grade rankings, trends and signals you can take straight to ministers, boards, investors and donor partners.

Build the wider picture

A foundation you can extend with trade, fertilizer, ODA, employment and country briefing modules into a fuller agricultural evidence toolkit.

User Manual

A complete, step by step user manual is included with your access. It walks through the element first workflow, every slicer, the Summary for Decision-Makers, the full Policy Signals and Deep Signals reference, the Trend Explorer, common analysis recipes and the methodology behind every figure.

How this dashboard is built

01Data Source & Coverage

Built on FAOSTAT QCL data, consolidating a long run global series for crops and livestock into one integrated interface for benchmarking and policy analysis.

  • 217 countries and territories for truly global coverage.
  • 273 products across crops, horticulture, commodities and livestock outputs.
  • 1961 to 2024 for six decades of structural comparison.
  • 8 elements and 7 units kept analytically valid.
  • Logic is selection driven: choose one element to activate consistent totals, rankings and signals.
02Refresh Cadence & Maintenance

Updated when the underlying FAOSTAT production series is refreshed and integrated into the TW Policy Group model.

  • Latest horizon currently extends to 2024.
  • Historical continuity is preserved for baseline comparison.
  • A normalization layer harmonises crops and livestock while keeping element and unit integrity intact.
  • Where FAOSTAT revises prior year values, those revisions flow into subsequent refreshes.
03Methodology & Interpretation

Designed to prevent invalid comparisons by keeping the selected element and unit at the centre of the logic.

  • Element first design: production, yield, area, stocks and animal counts are never merged into one misleading total.
  • Unit aware ranking: each ranking updates only within the selected measurement system.
  • Country and item signals adapt to a selected country, item or both for decision grade narrative.
  • Caution: high production volume does not by itself imply high productivity, competitiveness or sustainability. Read yield and area together.
Data Disclaimer

Data & Attribution. This page presents a TW Policy Group visualization and production dashboard built on FAOSTAT QCL data. Analysis and interpretation are TW Policy Group’s own.

No endorsement. FAO does not endorse any findings or interpretations contained in this dashboard. Any errors or interpretations are the sole responsibility of TW Policy Group.

Engage · Feedback & Updates

Feedback & Questions

Share a question, request an enhancement, or flag a data issue. Your feedback helps improve usability, interpretation and strategic value of the Global Crops & Livestock Products Dashboard dashboard.

Subscribe for Updates

Receive updates on new global production dashboards, methods notes, country modules and tailored agricultural analysis.