Oceania Food & Agriculture Trade
FAOSTAT Detailed Trade Matrix Dashboard (1986 to 2024)

Premium-access dashboard developed by TW Policy Group to track food and agriculture trade across Oceania, bilateral trade, trade balances, product dynamics, reporter–partner linkages, country benchmarking and market opportunities. Built to support sourcing, export diversification, food import resilience, regional connectivity and evidence-based trade strategy across Pacific and global markets.

14 Regional Reporters Pacific economies and global partners
Item+ Product Analysis FAOSTAT agricultural items
38yrs Historical Coverage 1986–2024
2 Partner Scopes regional and rest of world
3 Languages English · French · Spanish
2 Trade Directions imports and exports

What decisions can this dashboard help you make?

Investors & Agribusinesses

  • Identify expanding export and import markets
  • Compare product and partner concentration
  • Support sourcing, market-entry and investment due diligence

Government and Development Partners

  • Monitor food import dependence and trade balances
  • Benchmark national and regional trade performance
  • Prioritise export development, diversification and value-chain resilience

Researchers & Advisors

  • Analyse bilateral trade relationships and historical shifts
  • Compare countries, commodities and trading partners
  • Produce decision-ready evidence for briefs and strategies
🔎 Filter by Reporter Country Partner Country Product / Commodity Imports / Exports Year Top Rankings Market Opportunities
Free preview

Oceania Food & Agriculture Trade · Interactive DashboardExplore the public global preview, then unlock historical trends, bilateral trade, country benchmarking, market opportunities, executive summaries and multilingual analysis.

Unlock full dashboards →
01 / 08
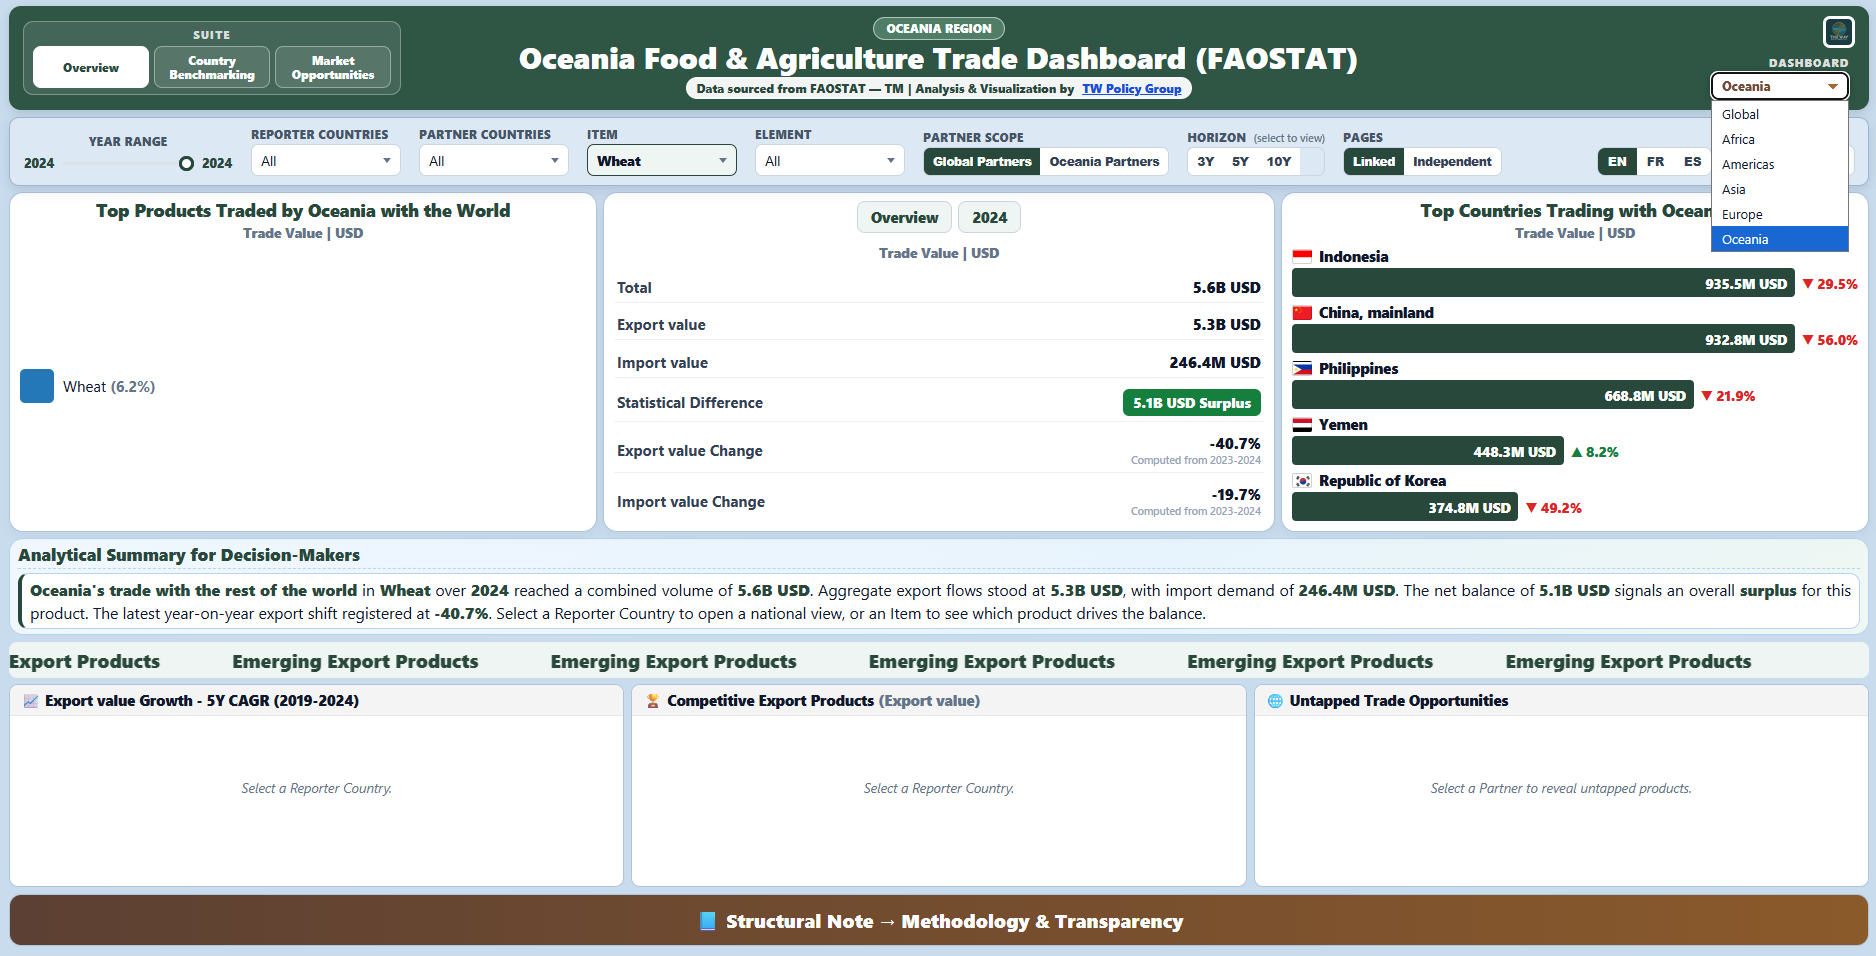
🌊 Oceania overview

See how Pacific economies compare before drilling into detail

The regional overview establishes the structure of food and agriculture trade across Oceania.

  • Establish a regional baseline.
  • Identify leading markets and products.
  • Move into country and opportunity analysis.

Everything included in your access

Every subscription provides the complete trade analysis experience for the selected scope.

Complete historical coverage. Analyse food and agriculture trade from 1986 through 2024.
Imports and exports. Switch between trade directions and compare values, growth and balance.
Bilateral trade matrix. Examine reporter-partner relationships by country, product and year.
Country benchmarking. Compare markets on trade scale, growth, balance and concentration.
Market Opportunity Explorer. Screen potential export destinations and import sourcing markets.
Product analysis. Identify leading commodities, emerging products and concentrated trade exposure.
Rankings and trends. View top countries, partners and products alongside long-run historical movement.
Executive summaries. Translate selected filters into clear decision-ready trade narratives.
Multilingual dashboards. Use equivalent English, French and Spanish analytical experiences.
Presentation-ready visuals. Use clean charts and comparisons in briefings, reports and client work.
Annual refresh included. Access includes the next integrated FAOSTAT data update during the subscription period.
Transparent methodology. Definitions, calculations and interpretation notes are included throughout.
Platform · Annual Subscriptions

Oceania Food & Agriculture Trade Dashboard Plans

Choose the level of Oceania-focused trade analysis your organisation needs, from complete continental coverage to advanced bilateral analysis, country benchmarking, market opportunity tools and organisation-wide access.

01

Essential

Core Oceania trade analysis

US$699

per year

  • Complete Oceania Food & Agriculture Trade Dashboard
  • Historical coverage from 1986 to 2024
  • Oceanian imports, exports and trade balances
  • Reporter, partner, product and year analysis
  • Intra-Oceanian and rest-of-world partner scopes
  • Country, product and partner rankings
  • Interactive charts and executive summaries
  • English, French and Spanish interface
  • Annual updates and email support
Subscribe · US$699/year
03

Business

Advanced regional trade analysis

US$1,199

per year

  • Everything in Professional
  • Advanced country and market benchmarking
  • Intra-Oceanian trade corridor analysis
  • Export diversification assessment
  • Food import dependence diagnostics
  • Trade concentration and resilience signals
  • Oceania regional integration analysis
  • Executive reporting and briefing support
  • Download-ready analytical visualisations
Subscribe · US$1,199/year
04

Enterprise

Organisation-wide Oceania trade access

US$1,999

per year

  • Everything in Business
  • Complete Oceania dashboard experience
  • Integrated global comparison access
  • Cross-regional benchmarking workflow
  • Institutional licensing and team access
  • Organisation onboarding and deployment support
  • Executive summaries and comparative analysis
  • Premium support
  • Early access to new features and releases
Subscribe · US$1,999/year
Institutional access available. Payment links can be connected after the subscription plans are created. Procurement documentation, invoicing and additional licences can be arranged through TW Policy Group.
Reports · One-Time Purchase

Country & Market Opportunity Reports

Order an executive-ready report prepared from the same FAOSTAT trade framework that powers the Oceania dashboard. Choose a focused country assessment or a deeper market-opportunity study.

Country analysis

Oceania Country Trade Report

A concise national trade profile and executive briefing.

US$349
one time
  • One selected Oceanian country
  • Imports, exports and trade balance
  • Leading products and trading partners
  • Intra-Oceanian and rest-of-world trade structure
  • Historical trade trends and growth
  • Product and partner concentration
  • Decision-maker executive summary
  • Professional PDF report
Order Report · US$349

What this trade platform helps you answer

Where is trade growing?

Track import and export growth across countries, products and bilateral corridors to identify structural momentum and emerging markets.

Who trades with whom?

Analyse reporter–partner linkages to understand the relationships carrying the greatest value and the markets shaping each country's trade position.

Which products matter most?

Rank products by trade value, growth and share to identify the commodities driving exports, imports and bilateral exchange.

Where are the dependency risks?

Measure partner and product concentration to identify reliance on a narrow set of suppliers, destinations or commodities.

How does one country compare?

Benchmark countries using consistent indicators for trade scale, growth, balance, concentration and market structure.

Where are the opportunities?

Screen potential export destinations and import sourcing markets using observed trade demand, existing capabilities and partner-market evidence.

How to use the Oceania Food & Agriculture Trade Dashboard

This page is fully dynamic. Use the dashboard to examine Oceania food and agriculture trade relationships, bilateral product flows, partner concentration, trade balances and market opportunities.

What you will see: regional trade views showing how imports and exports evolve across reporters, partners, products, partner scopes and time horizons.

  • Start with regional context: review the Oceania trade structure before narrowing to one country or territory.
  • Filter strategically: refine by Year, Reporter, Item, Partner, Partner Scope and Horizon.
  • Track trade direction: examine who exports to whom and where import or destination dependence is concentrated.
  • Assess trade balance: compare exports, imports, total trade and deficits or surpluses.
  • Identify concentration risk: use leading products and partners to detect dependence on narrow markets or commodities.
  • Use benchmarking and opportunity tools: compare countries and screen export or import markets.
  • Apply the findings: support policy, investment, sourcing, market-entry and advisory work.

How the trade dashboard is built

01Data source and Oceania coverage

The dashboard is built on the FAOSTAT Detailed Trade Matrix and filtered to Oceania reporter countries and territories, regional partners and trade with the rest of the world.

  • 14 regional reporters represented in the dashboard coverage.
  • Item-level agricultural trade across available FAOSTAT products.
  • Historical coverage from 1986 to 2024.
  • Partner scopes: regional and rest of world.
  • Trade directions: imports and exports.
  • Languages: English, French and Spanish.
02Core calculations
  • Total trade combines imports and exports for the selected analytical context.
  • Trade balance is calculated as exports minus imports.
  • Historical growth compares selected years and periods using consistent trade values.
  • Partner and product concentration measure how strongly trade depends on leading markets or commodities.
  • Country benchmarking applies a consistent indicator framework across selected economies.
03Market-opportunity interpretation

Opportunity analysis is designed as an evidence-based screening tool rather than a forecast or guaranteed commercial recommendation.

  • Export opportunity views connect existing export capability with observed destination-market demand.
  • Import opportunity views identify current supplier structures and potential alternative sourcing markets.
  • Users should combine dashboard findings with tariffs, logistics, standards, commercial research and national statistics before investment decisions.
04Updates and interpretation notes
  • The dashboard is refreshed when the latest validated FAOSTAT trade data are integrated.
  • The most recent years may be revised as national submissions are updated.
  • Reporter and partner values can differ because of timing, valuation, classification and reporting practices.
  • High trade value does not by itself establish competitiveness, profitability or market accessibility.
Data Disclaimer

Data & Attribution. This page presents a TW Policy Group visualization and trade dashboard built on FAOSTAT Detailed Trade Matrix. Analysis and interpretation are TW Policy Group’s own.

No endorsement. FAO does not endorse any findings or interpretations contained in this dashboard. Any errors or interpretations are the sole responsibility of TW Policy Group.

Engage · Feedback & Updates

Feedback & Questions

Share a question, request an enhancement, or flag a data issue. Your feedback helps improve usability, interpretation and strategic value of the Oceania Food & Agriculture Trade dashboard.

Subscribe for Updates

Receive updates on new Oceania trade dashboards, methods notes, country modules and tailored agricultural analysis.