Feedback & Questions
Ask a question, suggest an improvement, or report a data issue. Your note helps us improve accuracy, usability, and policy relevance.
Everything is fully dynamic. Findings update instantly and are translated into policy signals and briefs for decision-makers.
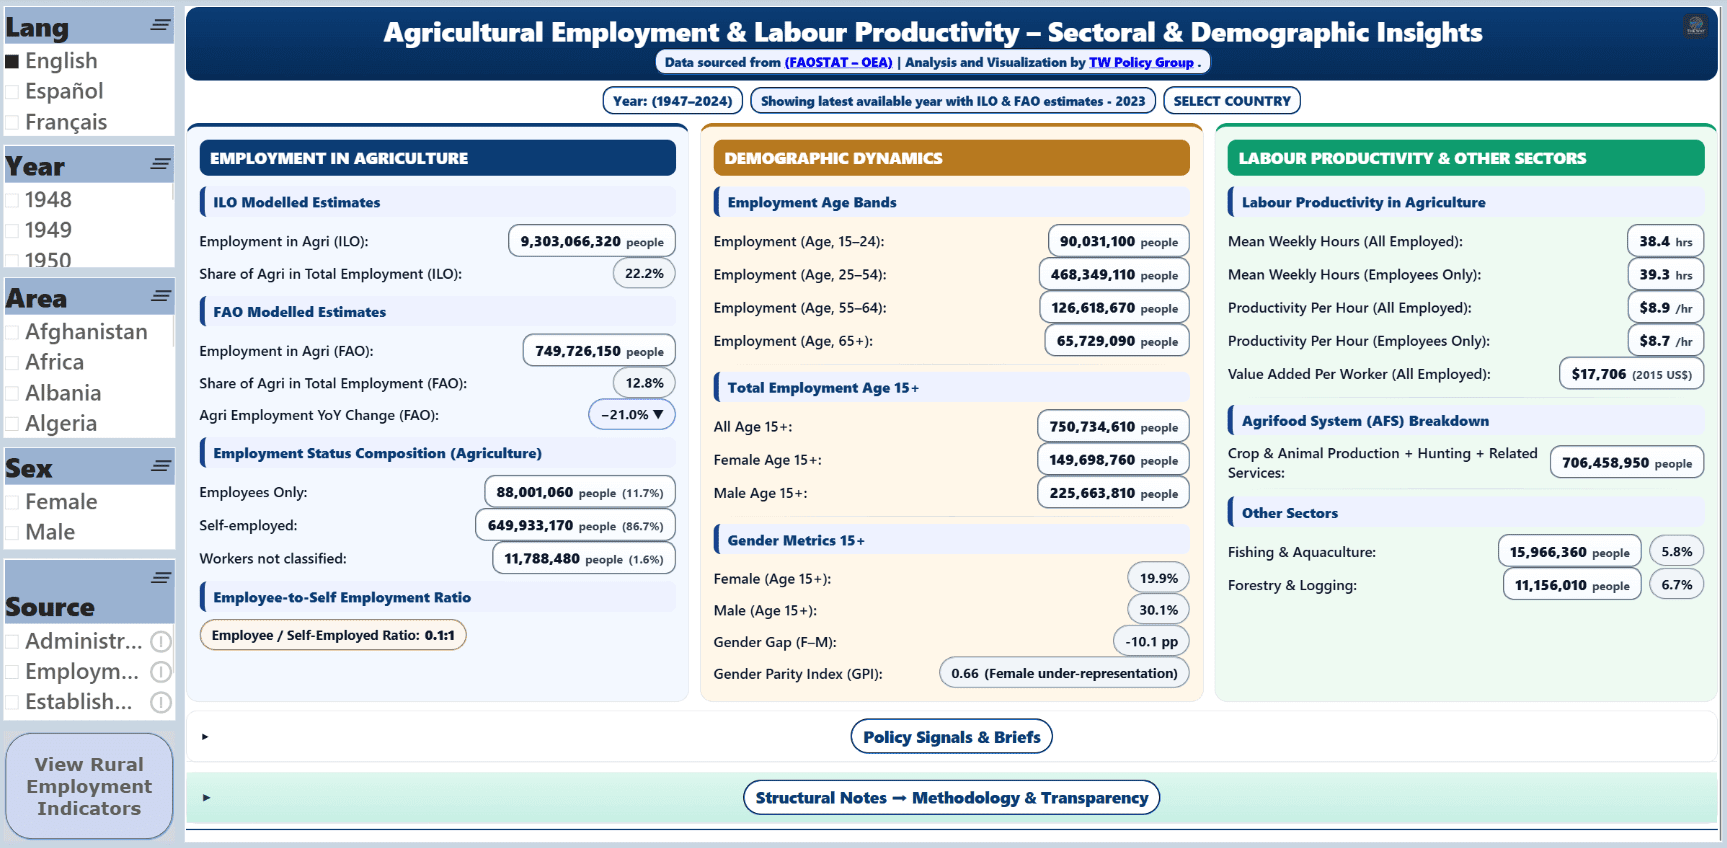
What you’ll see: a live dashboard with charts and small “signal” cards. These change as you choose a country, sex, age band, or data source.
Benchmark global agricultural employment and labour productivity across decades. Use this as your starting frame before drilling into countries, sex, and age cohorts.
Instant filtering by year, country, gender and data source allows embedded policy signals and briefs to auto-update, translating indicators into budget-ready actions and executive summaries.
Disaggregate across female/male shares, youth/older age bands, self-employment vs wage employment, enabling nuanced targeting of inclusion strategies grounded in comparative intelligence.
Measure shifts in agricultural labour, set targets for extension and skills programmes, and align tracking with SDG, CAADP, and AfCFTA frameworks.
Deploy under licence, white-label, or embed within national portals for ministries and donor-funded programmes; export images and briefs for reporting.
Detect early signs of structural employment risks such as over-reliance on self-employment, declining productivity per worker, demographic succession risks or persistent informality and design mitigation strategies for resilient rural economies.
Map gaps to investment levers and align with ODA windows (jobs, skills, mechanization, value-chain formalization) for bankable proposals.
Compare employment and productivity across countries and decades: prioritise regions, allocate resources, and structure impact frameworks at scale.
Extend with new datasets, countries, AI Q&A, custom KPIs, and LLM integrations to future-proof agricultural-rural employment intelligence.
Data & Attribution. Visualizations rely on FAOSTAT-OEA (Employment Indicators – Agriculture) datasets (© FAO). Figures may be revised by FAO; methodology and presentation by TW Policy Group. Use for decision support.
Open Access. Published as a public reference to support evidence-based employment policy, inclusive rural development, and alignment with global frameworks (SDG, CAADP, AfCFTA). Redistribution is permitted with clear attribution to FAO as the data source and TW Policy Group for the analysis and visualization. Please consult FAO’s Data Terms of Use and attribution guidance on the official FAO website.
No endorsement. FAO does not endorse any findings or interpretations. Any errors or interpretations are the sole responsibility of TW Policy Group.
Ask a question, suggest an improvement, or report a data issue. Your note helps us improve accuracy, usability, and policy relevance.
Get updates on new employment dashboards, methods notes, and occasional opportunities for tailored analysis.