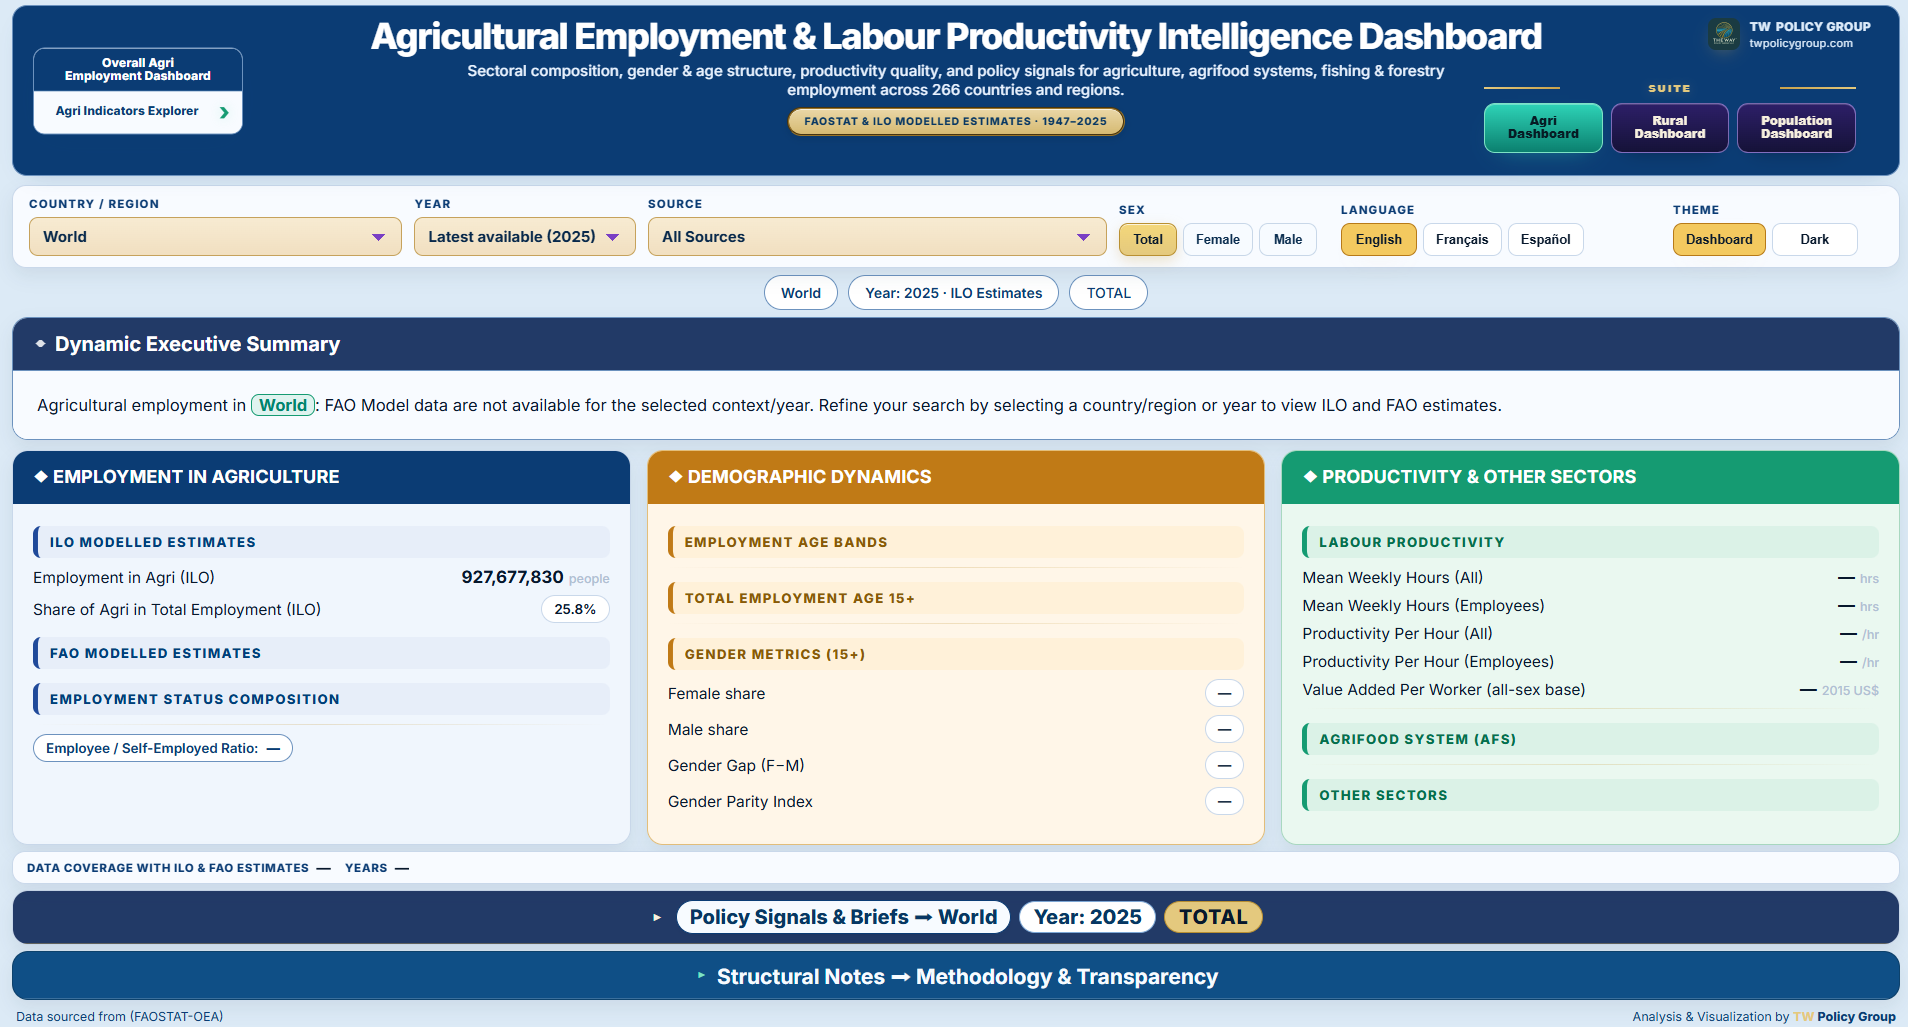
🧭Five integrated dashboards. Agriculture employment, rural employment and population views connected through one premium suite.
📝Dynamic executive summary. A plain-language brief that rewrites itself for any country, sex and year you select.
📡Automated policy signals. Momentum, vulnerable-employment, gender-gap and structural-shift signals translated into suggested actions.
👩🌾Gender & age depth. Female and male shares, gender parity index, youth and older-cohort age bands across the workforce.
📈Three momentum horizons. Year-on-year, 3-year and 5-year CAGR to read direction, not just the latest level.
🏆Rankings & trends. Animated leaderboards plus multi-decade trend lines for agriculture, rural employment and population.
🧮Productivity & structure. Labour productivity per hour and per worker, working hours, and self-employment vs wage employment.
🌍Global depth. Broad country coverage across agricultural employment, rural employment and population indicators, back to 1947 where available.
📚10 harmonised sources. FAO Model, ILO Modelled Estimates and eight ILOSTAT collections, kept comparable.
🖥️Briefing ready. Clean, presentation-grade views for ministers, boards, investors and donor partners.
🔁Annual refresh included. Your 12 months of access covers the next FAOSTAT-OEA and ILOSTAT data refresh.
🌐Your language. Identical capability in English, French and Spanish, all three included.