Global Agriculture, Rural Employment & Population Intelligence
FAOSTAT & ILO Employment Data Platform (1947 to 2025)

Decision-ready labour, demographic and rural development evidence from one integrated platform.

An institutional platform built by TW Policy Group for governments, development partners, investors and researchers. Compare countries, switch languages, explore gender and age gaps, review automated policy signals, read executive summaries and connect Agricultural Employment, Rural Employment and Population dynamics in one premium workflow.

263+Countries / Regionsglobal coverage
70+Indicators32 Agri ¡ 23 Rural ¡ Population
79+ yrsTime Horizon1947 to 2025
5Dashboardsintegrated suite views
3Core DomainsAgri ¡ Rural ¡ Population
3LanguagesEN ¡ FR ¡ ES

What decisions can this suite help you make?

Governments & Ministries

  • Track agricultural and rural job creation and decline
  • Monitor youth, gender and vulnerable employment
  • Target extension, skills and formalisation programmes

Donors & Development Banks

  • Align jobs and skills financing with the evidence
  • Benchmark countries for portfolio prioritisation
  • Map gaps to SDG, CAADP and AfCFTA frameworks

Investors & Researchers

  • Read labour productivity and structural transformation
  • Compare wage vs self-employment and informality
  • Build evidence for due diligence and analysis
🔎 Filter byCountry / RegionYearSexIndicatorSourceLanguageMeasurePolicy SignalsTime Series
🌍 Free · Open access

Employment in Agriculture (Time Series)

Use it to explore agriculture employment time series, animated rankings and long-run changes before upgrading to the full agriculture, rural employment and population intelligence suite.

Unlock full dashboards →
Source: FAOSTAT employment in agriculture values and shares. Use: Pause, replay, adjust speed, change theme and compare country rankings over time.
01 / 11
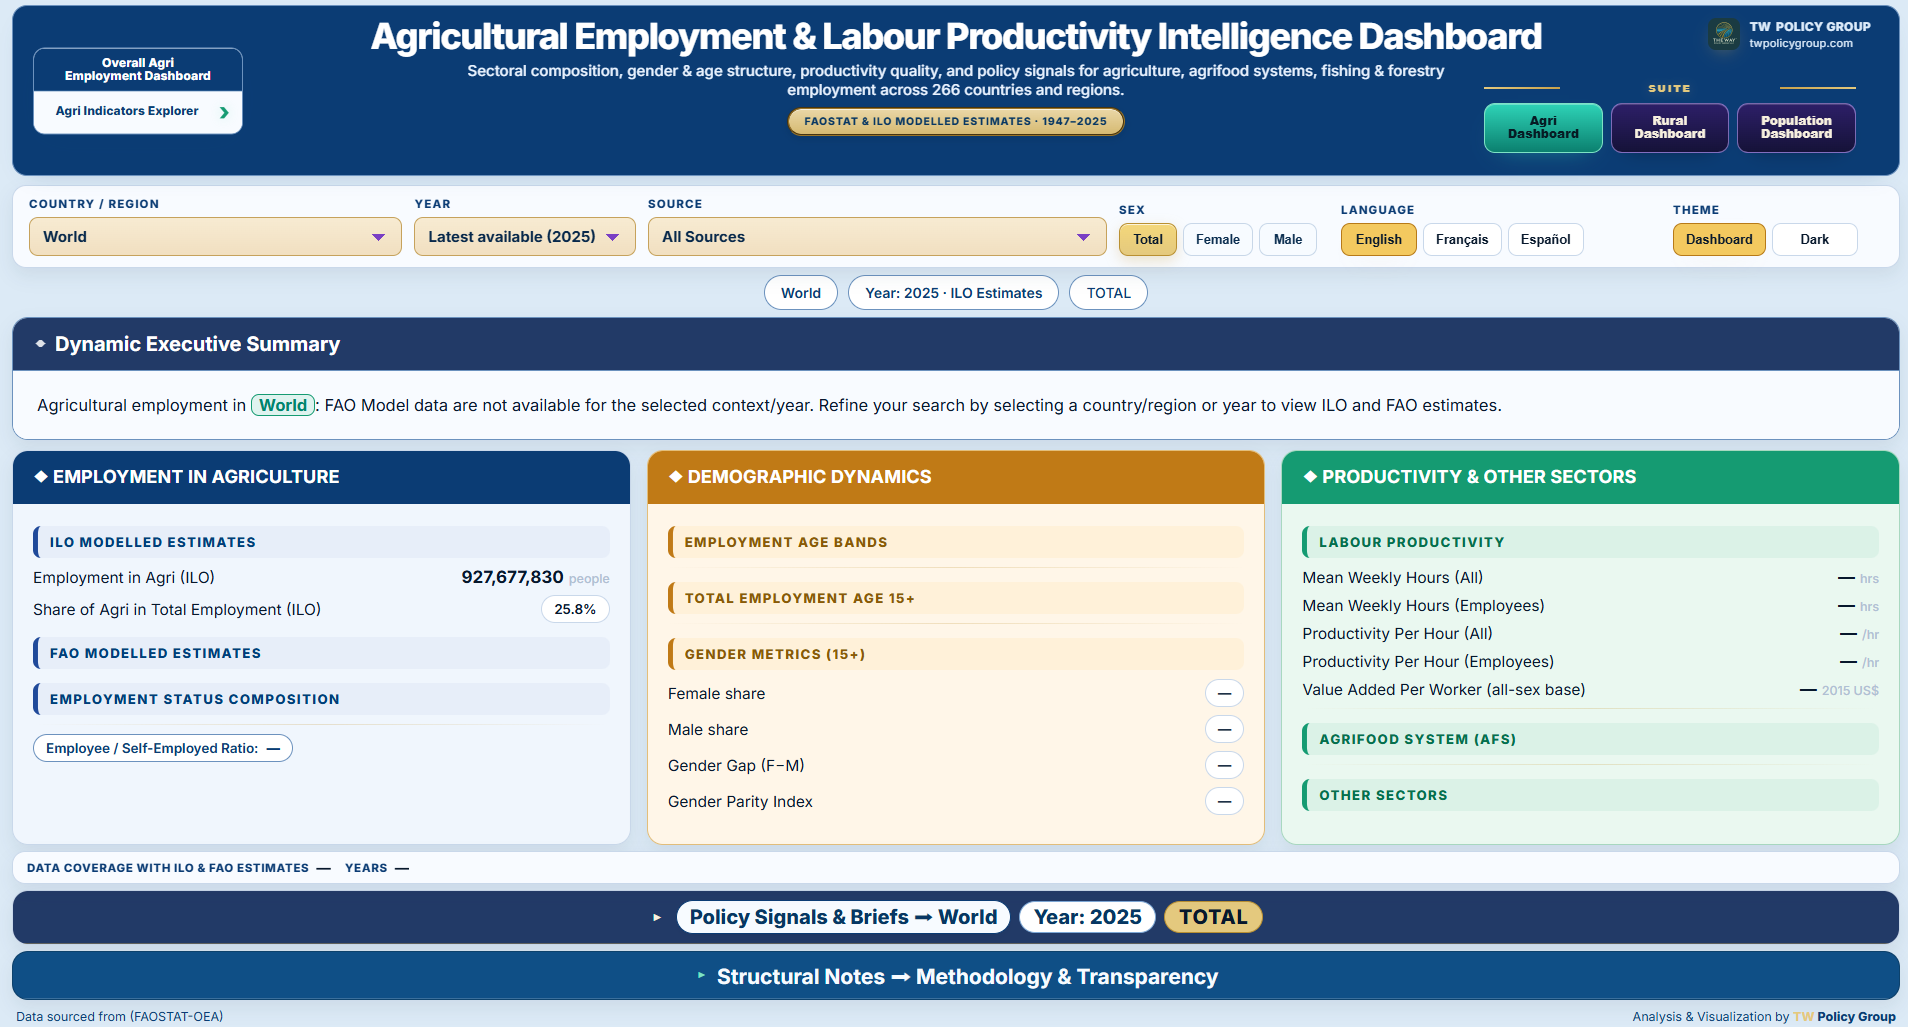
🌍 Executive overview · Agriculture employment

Start with the executive dashboard

The first visual should show the premium experience immediately: country coverage, executive summaries, indicators, and decision-ready layout.

  • Show the product as institutional intelligence, not a raw chart.
  • Lead with executive-ready dashboard design.
  • Set up the value of the full suite.

Everything included in full access

Five integrated dashboards, three languages, and a complete employment, rural development and population intelligence workflow.

🧭Five integrated dashboards. Agriculture employment, rural employment and population views connected through one premium suite.
📝Dynamic executive summary. A plain-language brief that rewrites itself for any country, sex and year you select.
📡Automated policy signals. Momentum, vulnerable-employment, gender-gap and structural-shift signals translated into suggested actions.
👩‍🌾Gender & age depth. Female and male shares, gender parity index, youth and older-cohort age bands across the workforce.
📈Three momentum horizons. Year-on-year, 3-year and 5-year CAGR to read direction, not just the latest level.
🏆Rankings & trends. Animated leaderboards plus multi-decade trend lines for agriculture, rural employment and population.
🧮Productivity & structure. Labour productivity per hour and per worker, working hours, and self-employment vs wage employment.
🌍Global depth. Broad country coverage across agricultural employment, rural employment and population indicators, back to 1947 where available.
📚10 harmonised sources. FAO Model, ILO Modelled Estimates and eight ILOSTAT collections, kept comparable.
đŸ–Ĩī¸Briefing ready. Clean, presentation-grade views for ministers, boards, investors and donor partners.
🔁Annual refresh included. Your 12 months of access covers the next FAOSTAT-OEA and ILOSTAT data refresh.
🌐Your language. Identical capability in English, French and Spanish, all three included.

Why organizations choose TW Policy Group instead of raw FAOSTAT-OEA and ILOSTAT estimates

The data providers give numbers. We give decision-ready employment intelligence.

✓Former WTO and international trade expertise
✓Executive-ready summaries that write themselves
✓Automated policy signals and structural interpretation
✓Gender, age and vulnerable-employment disaggregation
✓FAO and ILOSTAT sources harmonised into one model
✓Institutional-grade visuals for presentations
✓Multilingual delivery (English, French, Spanish)
✓Briefing materials ready for governments and donors
✓Saves weeks of data cleaning, modelling and charting
Two ways to work with this data

Choose your path

Subscribe to the live intelligence platform for ongoing analysis, or order a premium one-time report for a specific country or comparison. The same dashboard intelligence engine powers both.

Intelligence Platform

A live, interactive suite your team uses all year to compare countries, switch languages, explore policy signals and move from data to decision-ready analysis.

  • Five integrated dashboards across employment, rural and population intelligence
  • Executive summaries, policy signals, time series and animated rankings
  • Annual data refresh and all three languages included

From $799/year ¡ EN ¡ FR ¡ ES

See subscription plans

Intelligence Reports

A polished, point-in-time PDF and PowerPoint report for a country, profile or multi-country comparison. No subscription required.

  • Executive summary, visuals and policy signals
  • Country, rural-agricultural, population and comparison options
  • Built for briefings, proposals, cabinet notes and donor memos

From $149 one time

See report options
Platform ¡ Annual subscription

Four Premium Dashboard Subscription Offers

Choose the exact intelligence layer your organization needs, then upgrade when you need broader country, rural, population or production intelligence.

Agriculture Employment Intelligence

Standalone agriculture employment subscription

$799

per year ¡ all 3 languages

  • Overall Agriculture Employment Dashboard
  • Agriculture Indicators Explorer — 32 indicators
  • Country executive summaries
  • Gender, work status, productivity and age structure
  • Policy signals and suggested briefs
  • Animated rankings and time-series views
  • EN ¡ FR ¡ ES included

Best for agriculture ministries, food security teams, research units and agriculture investment analysts.

Secure checkout powered by Memberstack + Stripe

Rural Employment Intelligence

Standalone rural employment subscription

$799

per year ¡ all 3 languages

  • Overall Rural Employment Dashboard
  • Rural Indicators Explorer — 23 indicators
  • Rural workforce structure and participation
  • Employment-to-population and LFPR indicators
  • Gender parity, vulnerability and rural transformation signals
  • Executive summaries and report-ready visuals
  • EN ¡ FR ¡ ES included

Best for labour ministries, rural development teams, ILO projects and inclusion programmes.

Secure checkout powered by Memberstack + Stripe

Most popular

Agriculture + Rural Employment Suite

Integrated employment intelligence suite

$1,399

per year ¡ all 3 languages

  • Everything in Agriculture Employment — 32 agri indicators
  • Everything in Rural Employment — 23 rural indicators
  • Connected navigation across dashboards
  • Shared reporting workflow for ministries and partners
  • Country benchmarking across agriculture and rural labour markets
  • Integrated policy signals and executive-ready outputs
  • Priority support for institutional users

Best value for organizations working across agriculture, labour, rural development and structural transformation.

Secure checkout powered by Memberstack + Stripe

Flagship

Agriculture + Rural Employment + Population Suite

Complete institutional intelligence suite

$1,699

per year ¡ all 3 languages

  • Everything in the Agriculture + Rural Suite
  • Population Dashboard and Population Indicators Explorer
  • Total population, sex, share %, urban/rural and time-series analysis
  • Demographic context for jobs, rural transition and service planning
  • Five distinct dashboard experiences
  • Premium executive and policy intelligence workflow
  • Best for institutional planning and multi-sector strategy

Flagship subscription for governments, development banks, UN agencies and national planning teams.

Secure checkout powered by Memberstack + Stripe

Recommended pricing logic. The two standalone products are accessible at $699/year each. The Agriculture + Rural suite creates a clear bundle saving at $1,199/year. The complete Agriculture + Rural + Population suite is the flagship institutional offer at $1,699/year and should be promoted as the default option for policy, development and planning clients.
â„šī¸
How platform access works. Once payment links are added, subscribers can pay securely by card and access is provisioned to their work email. Government, development bank or UN buyers can request institutional invoicing, procurement paperwork or multi-seat rollout. Coverage note: dashboards show the best available FAOSTAT, ILOSTAT and population data; coverage varies by country, year, source and indicator.
Reports ¡ One-time purchase

Premium Country & Comparative Intelligence Reports

Four focused report products, built from the same dashboard intelligence engine and delivered as PDF and PowerPoint. Every paid report is substantive, premium and decision-ready.

Country Employment Report

Single-country agriculture employment brief

$149

one-time report

  • 1 country ¡ Agriculture Employment focus
  • Executive summary and key employment signals
  • Latest year plus historical trend context
  • Gender and work-status insights where available
  • Policy signal overview and chart pack

A practical entry report for briefing notes, proposals and country screening.

Order report ¡ $149

Secure Stripe checkout ¡ PDF & PowerPoint delivery

Rural + Agricultural Profile

Integrated jobs and rural development profile

$299

one-time profile

  • 1 country ¡ Agriculture + Rural Employment
  • Rural labour participation, EPR and LFPR
  • Agriculture employment structure and productivity
  • Gender and vulnerable-employment signals
  • Combined policy interpretation and recommendations

Best for rural transformation, labour-market and agriculture programme design.

Order profile ¡ $299

Secure Stripe checkout ¡ PDF & PowerPoint delivery

Best profile

Rural + Agricultural + Population Profile

Flagship single-country profile

$349

one-time profile

  • 1 country ¡ Agriculture + Rural + Population
  • Employment, rural labour and demographic context
  • Population by sex, share %, urban/rural and trend views
  • Executive summary, policy signals and strategic interpretation
  • Decision-ready recommendations for planning and investment

The best one-time product for ministries, donors and national planning teams.

Order profile ¡ $349

Secure Stripe checkout ¡ PDF & PowerPoint delivery

Multi-Country Comparison

Compare 2 to 3 countries for strategy and investment

$499

one-time comparison

  • 2 to 3 countries
  • Agriculture, Rural, Population or combined scope
  • Side-by-side benchmarking and rankings
  • Comparative policy signals and country positioning
  • Presentation-ready charts and executive comparison

Ideal for focused cross-country benchmarking, donor briefs, investor screening and policy comparison.

Order comparison ¡ $499

Secure Stripe checkout ¡ PDF & PowerPoint delivery

â„šī¸
How reports work. After checkout you confirm the exact country or countries, dashboard scope, sex and language on a short form. We build the report from the live model and email the PDF and PowerPoint. No account or subscription needed. Every report contains the best available data for the selected country, indicators and source.
📍
Coverage depends on the selected country and available datasets. Each subscription and report delivers the best available FAOSTAT, ILOSTAT and population data. Where sources, sex-disaggregation, rural employment or population series are partial, we flag gaps clearly rather than estimate around them.
Compare reports

Which report is right for you?

Use this comparison to choose the report that matches your decision need — from a quick country employment brief to a multi-country benchmark for strategy, investment and programming.

FeatureCountry EmploymentRural + AgRural + Ag + PopulationMulti-Country
Best when you needA fast agriculture employment briefBest for briefing notes, proposals and screening.A combined rural labour and agriculture profileBest for programme design and labour-market context.A full country profile linking jobs, rural structure and demographicsBest for national planning, donor dialogue and investment cases.A comparative view across several countriesBest for regional strategy, portfolio screening and benchmarking.
Countries1112 to 3
Dashboard scopeAgriculture Employment
Includes 32 agriculture indicators where available.
Agriculture + Rural Employment
Includes 32 agriculture + 23 rural indicators where available.
Agriculture + Rural Employment + Population
Adds demographic, share %, sex and urban/rural population context.
Selected scope across countries
Choose agriculture, rural, population or combined scope.
Executive summary✓✓✓✓
Policy signals✓✓✓✓
Agriculture Indicators Explorer✓32 indicators✓32 indicators✓32 indicators✓selected countries
Rural Indicators Explorer—✓23 indicators✓23 indicators✓optional scope
Population and demographic context——✓Optional
Benchmarking and rankingsBasicCountry-levelCountry-level✓
PDF + PowerPoint✓✓✓✓
Price$149
Entry report
$299
Best for programmes
$349
Best country profile
$499
Best for comparison
â„šī¸
Not sure which to choose? Start with the Rural + Agricultural + Population Profile when your decision involves jobs, rural transformation and demographic planning in one country. Choose Multi-Country Comparison when the decision is about prioritising countries or comparing opportunities.

Government & Development Partner Solutions

Bespoke, analyst-led employment intelligence and dashboards built to an institution's exact mandate, from agriculture employment and rural jobs strategies to population-informed planning, youth employment, gender inclusion and structural transformation programmes.

Ministries of Labour & AgricultureDevelopment BanksUN AgenciesDonor ProgramsResearch InstitutesStatistics Offices
FAQ

Frequently asked questions

Do all countries have data for every year, indicator and source?▾
No. Coverage varies by country and dataset. Some countries have long time series, while others have partial coverage. Some countries may not have rural employment data or complete sex-disaggregated data. All subscriptions and reports use the best available FAOSTAT and ILOSTAT data for your selected country, indicator and source.
What exactly do I get for my selected country?▾
You receive every available year, indicator, source and sex disaggregation that exists for your selection, no more and no less. Where a particular series, source or rural dataset is not available for a country, the report or dashboard reflects what is available and flags the gap rather than estimating around it.
Is rural employment data available for every country?▾
No. Rural Employment covers 161 countries, fewer than the 263 in Agricultural Employment. If you choose a country without rural data for a Premium plan or a Rural + Agricultural report, we will tell you and focus on the available agricultural data, or suggest the closest suitable scope.
What data sources do you use?▾
Ten harmonised sources: the FAO Model, ILO Modelled Estimates and eight ILOSTAT collections (administrative records, employment surveys, establishment census, household income and expenditure survey, household survey, labour force survey, official estimates and population census), consolidated into the TW Policy Group model. Not every source is available for every country.
Which subscription plan should I choose?▾
Choose Agriculture Employment or Rural Employment if you need one standalone domain. Choose Agriculture + Rural Employment for integrated jobs and rural-development analysis. Choose the complete Agriculture + Rural + Population Suite when you need demographic context, planning intelligence and the full five-dashboard workflow, for the countries where rural data is available.
Is the Time-Series Dashboard really free?▾
Yes. The Time-Series Dashboard above is open access and fully interactive, no sign-up. A subscription unlocks the full Agricultural and Rural Employment dashboards, with the executive summary, policy signals and complete available indicator sets.
Which languages are included?▾
All three, English, French and Spanish, are included in both subscription plans at one price. Reports can be produced in any of the three.
What years and countries are covered?▾
Agricultural Employment spans up to 1947 to 2025 across 263 countries and regions. Rural Employment spans up to 1952 to 2025 across 161 countries. The exact span available depends on the selected country.
How long does report delivery take?▾
Typically 24 to 72 hours after you confirm your report specifics.
What format do I receive reports in?▾
Reports are delivered as both PDF and PowerPoint.
Do I need a subscription to buy a report?▾
No. Reports are a standalone one-time purchase, with no subscription or account required.
Can ministries request bespoke work?▾
Yes. Our Government & Development Partner Solutions cover fully bespoke, analyst-led engagements scoped to your mandate, with institutional invoicing available.

Ready to turn employment data into actionable intelligence?

Choose your path

Subscribe to the Intelligence Platform

Get dashboard access

Order an Intelligence Report

Order a report

Discuss a Government Solution

Contact our team

What you can do with it

Benchmark any country

See how a country's agricultural and rural employment compares to the world, surfacing leaders, laggards and overlooked mid-tier cases, then frame jobs, skills and inclusion strategy on the evidence.

Read momentum, not just levels

The policy-signal layer translates raw numbers into interpretation, growth, decline, vulnerability and structural shift, so the story sits on the same screen as the data.

See who is left behind

Disaggregate by sex and age to expose gender gaps, youth participation and vulnerable, own-account employment, the detail that drives real inclusion policy.

Track structural transformation

Pair employment with labour productivity and status composition to judge whether jobs are getting better, not just more numerous.

Brief decision-makers

Clean, presentation-grade summaries, rankings and signals you can take straight to ministers, boards, investors and donor partners.

Build the wider picture

A foundation you can extend with the Crops & Livestock, trade and country-briefing modules into a fuller agricultural intelligence stack.

User Manual

A complete, step-by-step user manual is included with your access. It walks through every slicer, the dynamic executive summary, the full policy-signals reference, the Time-Series Dashboard, common analysis recipes and the methodology behind every figure.

How this suite is built

01Data Sources & Coverage

Built on FAOSTAT and ILOSTAT employment data, consolidating long-run global series into one intelligence interface for benchmarking and policy analysis.

  • 263 countries and regions across the suite.
  • Agricultural Employment: up to 1947 to 2025, 32 indicators.
  • Rural Employment: up to 1952 to 2025, 161 countries, 23 indicators.
  • 10 sources (FAO Model, ILO Modelled Estimates and eight ILOSTAT collections) kept comparable.
  • Coverage varies by country: years, indicators, sources and sex disaggregation may be partial or unavailable for some countries.
02Refresh Cadence & Maintenance

Updated when the underlying FAOSTAT and ILOSTAT series are refreshed and integrated into the TW Policy Group model.

  • Latest horizon currently extends to 2025.
  • Historical continuity is preserved for baseline comparison.
  • A normalization layer harmonises FAO and ILOSTAT sources while keeping indicator integrity intact.
  • Where providers revise prior-year values, those revisions flow into subsequent refreshes.
03Methodology & Interpretation

Designed to keep comparisons valid by aligning indicators, sex and source within each selection.

  • Selection-driven logic: totals, shares, rankings and signals all respond to the chosen country, sex, source and year.
  • Source-aware: FAO and ILOSTAT estimates are presented transparently so users can compare modelled and survey-based figures.
  • Availability-aware: where data does not exist for a selection, the interface shows what is available rather than estimating around the gap.
  • Caution: high employment volume does not by itself imply quality of work. Read productivity, status composition and vulnerability together.
Data Disclaimer

Data & Attribution. This page presents a TW Policy Group visualization and employment intelligence interface built primarily on FAOSTAT-OEA data, with ILOSTAT data and estimates where relevant (Š FAO, Š ILO). Analysis and interpretation are TW Policy Group's own.

Coverage & availability. Coverage varies by country and dataset. Figures reflect the best available FAOSTAT-OEA data, complemented by ILOSTAT data and estimates where relevant, and may be partial or unavailable for some countries, years, sources, indicators or sex disaggregations. Subscriptions and reports deliver the data that is available for the selected scope; we do not estimate or fabricate values where data does not exist.

No endorsement. FAO and ILO do not endorse any findings or interpretations contained in this suite. Any errors or interpretations are the sole responsibility of TW Policy Group.

Engage ¡ Feedback & Updates

Feedback & Questions

Share a question, request an enhancement, or flag a data issue. Your feedback helps improve the usability, interpretation and strategic value of the employment suite.

Subscribe for Updates

Receive updates on new employment dashboards, methods notes, country modules and tailored employment intelligence.