Open Dashboard
Quick User Manual
Everything is fully dynamic. Findings update instantly and are translated into policy signals and briefs for decision-makers.
What you’ll see: a live dashboard with charts and small “signal” cards. These change as you choose a country, species, or FAO area.
- Pick a view: start global, then try a Country, an ASFIS Species, or a FAO Area.
- Read the top line: it tells you the time range and what is currently selected.
- Watch the numbers: YoY (last year), 3-year and 5-year change show the direction of catch.
- PC5 / CR5: how much the top 5 species (PC5) or countries (CR5) dominate.
- NEI: “Not Elsewhere Included.” Higher NEI can mean weaker species identification or gaps in reporting.
- Policy signals: short notes that turn the data into suggested actions.
Snapshot of Dahsboard Signals
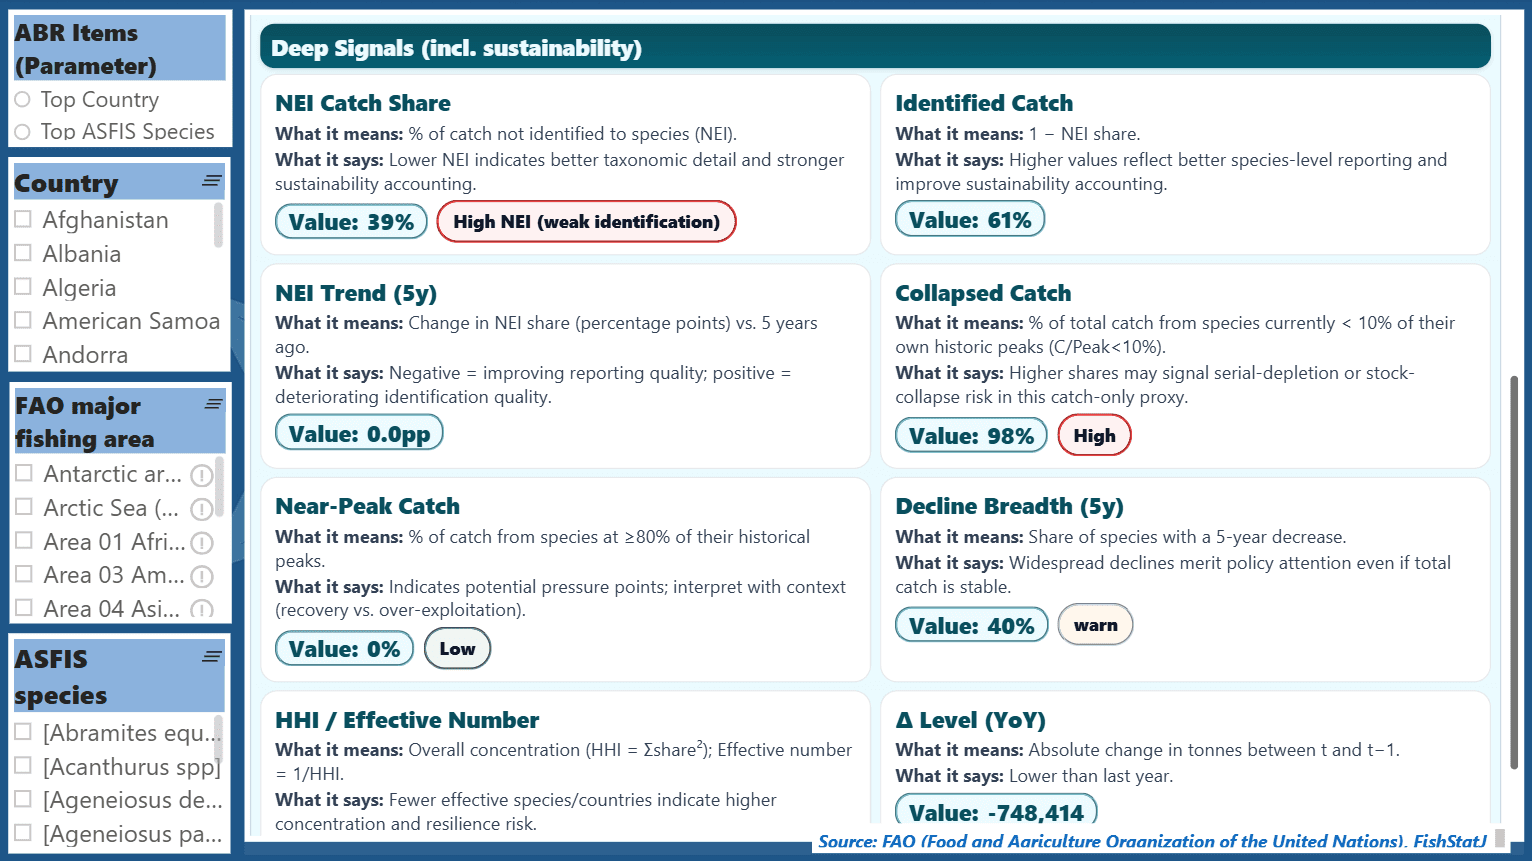
Decision-ready overview for policy dialogue
Review global signals for concentration (PC5/CR5), reporting quality (NEI), and structural pressures. Use this as your starting frame before drilling into countries, species, and FAO areas.
- Scan global trends and deep-dive candidates.
- Flag high-concentration species clusters and NEI risks.
- Open policy briefs aligned to donor windows.
Strategic Value for Fisheries Policymakers & Partners
Species & Area Targeting
Pinpoint ASFIS species and FAO areas where concentration (PC5/CR5) and momentum suggest viable—and sustainable—expansion paths.
NEI & Reporting Quality
Assess NEI levels to gauge identification strength, data gaps, and monitoring requirements before committing funds.
Risk & Sustainability Signals
Surface deep signals that combine breadth, trends, and concentration—supporting safeguards, certification, and traceability components.
Area & RFMO Alignment
Pivot insight by FAO Area to align analytics with RFMO mandates, regional plans, and transboundary stock coordination—streamlining compliance and joint management.
Evidence for Negotiations
Ground quota, access, and trade discussions in transparent indicators (CR5/PC5, NEI, top-share signals) and FAO-consistent methods—strengthening positions with comparable, auditable evidence.
Policy Briefs & Delivery
Generate brief notes tied to indicators for rapid budget asks, implementation steps, and partner alignment.
Comparative Benchmarking
Benchmark producer countries across decades to spot outliers, catch plateaus, and diversification opportunities.
Embed & Scale
Embed under licence or white-label; extend with additional datasets, AI Q&A, custom KPIs, and national reporting portals.
Data & Attribution. Visualizations rely on FAO FishStatJ (Capture Production) datasets (© FAO). Figures may be revised by FAO; methodology and presentation by TW Policy Group. Use for decision support.
Open Access. Published as a public reference to support transparency around the WTO Agreement on Fisheries Subsidies (entry into force on 15 September 2025) and its implementation. Redistribution is permitted with clear attribution to FAO as the data source and TW Policy Group for the analysis and visualization. Please consult FAO’s Data Terms of Use and attribution guidance on the official FAO website.
No endorsement. FAO does not endorse any findings or interpretations. Any errors or interpretations are the sole responsibility of TW Policy Group.
Feedback & Questions
Ask a question, suggest an improvement, or report a data issue. Your note helps us improve accuracy, usability, and policy relevance.
Subscribe for Updates
Get updates on new fisheries dashboards, methods notes, and occasional opportunities for tailored analysis.