Ocean ODA Scale
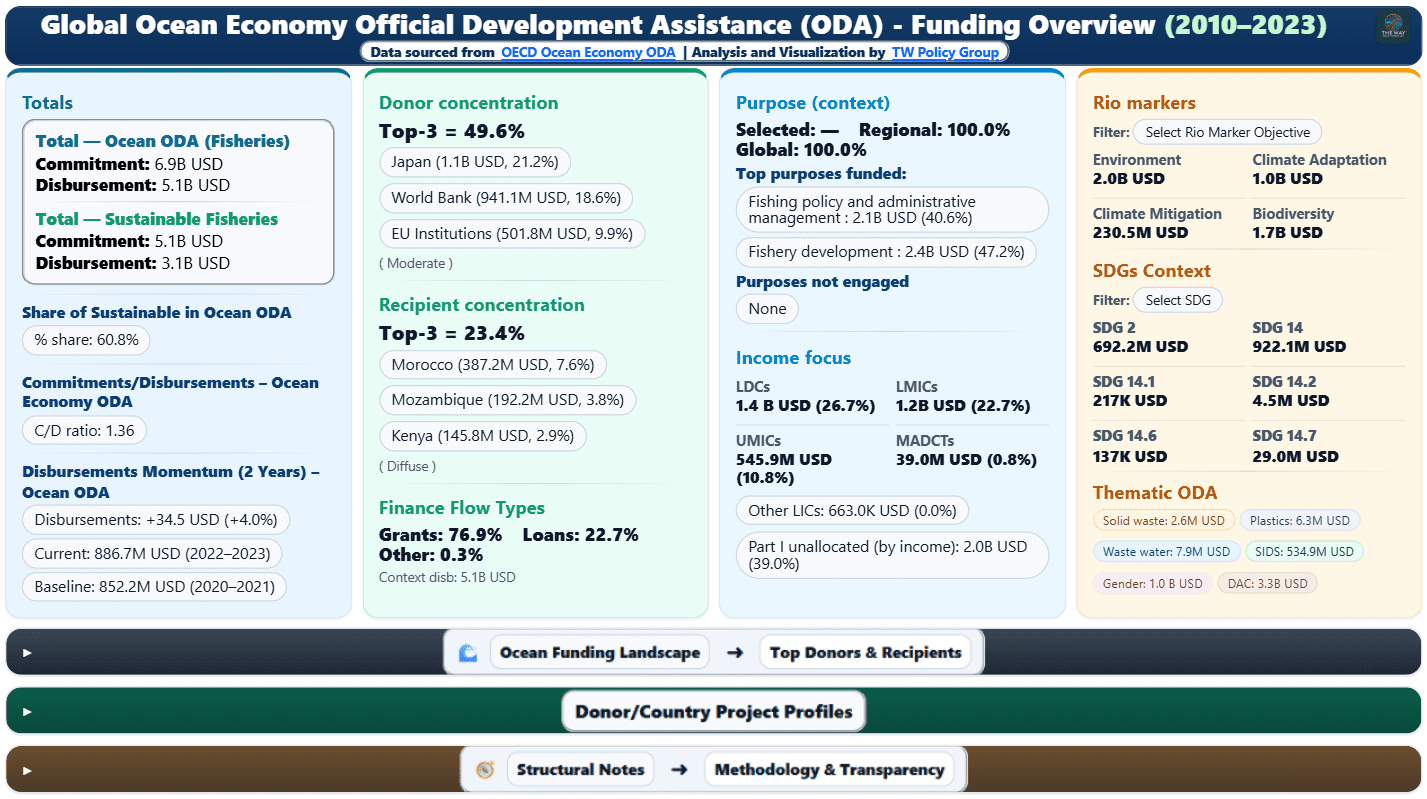
Total fisheries-related ocean ODA reached $6.9B in commitments and $5.1B in disbursements, with sustainable fisheries representing a large share of the broader ocean ODA envelope.
Official Development Assistance · 2010–2023
Premium-access dashboard powered by OECD CRS / DAC Aid Activity data, developed by TW Policy Group to track Official Development Assistance flows for fisheries, sustainable fisheries, and ocean economy initiatives — donors, recipients, project values, finance modalities, and purpose classifications. Built to support evidence-based blue-economy investment strategy, ODA programming, food-systems planning, and alignment with SDG 14, AfCFTA, and global ocean sustainability priorities.
Total fisheries-related ocean ODA reached $6.9B in commitments and $5.1B in disbursements, with sustainable fisheries representing a large share of the broader ocean ODA envelope.
Sustainable fisheries accounted for $5.1B in commitments and $3.1B in disbursements, equivalent to a 60.8% share of ocean ODA in the overview.
Across the full overview, funding is primarily grant-financed, with loans forming the secondary channel and a very small residual share classified as other flows.
The largest purposes funded are Fishery development and Fishing policy and administrative management, showing a mix of production support and governance reform.
The 2023 pattern shows significant orientation toward LDCs, while a large portion remains partly unallocated by income group, reflecting regional and cross-cutting programmes.
The page is designed for donor coordination, marine strategy, fisheries portfolio benchmarking, recipient opportunity scanning, and executive-ready communication.
This page is fully dynamic. Use the embedded dashboard to explore ODA flows for fisheries and ocean economy initiatives, track donor and recipient trends, and analyse project-level investment patterns across 13+ years of DAC data.
What you'll see: an interactive ODA intelligence interface showing how official development assistance for fisheries is allocated — by donor, recipient country, purpose code, income group, finance modality, and disbursement trajectory.
Built on the OECD Creditor Reporting System (CRS), the authoritative global reference for bilateral and multilateral ODA activity data, published by the OECD Development Assistance Committee (DAC).
The OECD CRS database is updated annually as DAC members submit activity-level reporting for the previous calendar year.
TW Policy Group applies a consistent, transparent processing layer over the raw CRS data to ensure cross-donor, cross-recipient, and cross-time comparability.
The overview surface collapses 14 years of fisheries and ocean economy ODA into a single readable dashboard. Designed as the entry point for development professionals, fisheries policymakers, and donor strategists who need a high-level situational read before exploring specific corridors, donors, or recipient groups.
Track ODA flows to fisheries and ocean economy across donors, recipients, and funding instruments to understand who is investing in what, where, and at what scale.
Identify the major bilateral and multilateral financiers, analyse donor concentration, and map gaps in the official support architecture for sustainable fisheries.
Compare ODA per capita, fisheries GDP share, and income group allocations to surface underfunded recipients and frame the case for reprogramming or scale-up.
Link ODA flows to Sustainable Development Goal 14 targets, AfCFTA fisheries provisions, and regional ocean governance commitments to demonstrate strategic coherence.
Translate ODA landscape data into investment priorities for value chains, fisheries management, coastal resilience, aquaculture, and blue finance instruments.
Expose the pipeline gap between pledged and delivered ODA to inform implementation performance monitoring and accountability conversations with donors.
Use polished dashboard snapshots and filtered views to produce briefing notes, board presentations, donor dialogues, and strategic memoranda on ocean economy finance.
Extend the dashboard with additional sectors, country modules, climate-finance overlays, AI Q&A, custom KPIs, and related blue-economy intelligence over time.
Data & Attribution. This page presents a TW Policy Group visualization and ODA intelligence interface built on OECD Creditor Reporting System (CRS) data. Any underlying source datasets, purpose classifications, or methodology notes should be cited separately where applicable.
Open Access. Published as a public reference to support evidence-based fisheries and ocean economy policy, ODA programming, and alignment with global frameworks (SDG 14, AfCFTA, WTO Fisheries Agreement). Redistribution is permitted with clear attribution to the OECD DAC as the data source and TW Policy Group for the analysis and visualization. Please consult OECD's ODA data terms and attribution guidance on the official OECD website.
No endorsement. The OECD does not endorse any findings or interpretations contained in this dashboard. Any errors or interpretations are the sole responsibility of TW Policy Group.
Share a question, request an enhancement, or flag a data issue. Your feedback helps improve usability, interpretation, and strategic value of the ODA dashboard.
Receive updates on new ODA and blue-economy dashboards, methods notes, and opportunities for tailored ocean economy analysis.