Global Agricultural Trade (1986–2024)

Premium-access dashboard powered by the FAOSTAT Detailed Trade Matrix, developed by TW Policy Group to track global agricultural trade flows, trade balances, product dynamics, reporter–partner linkages, and market structure. Built to support evidence-based trade strategy, export diversification, food systems planning, and alignment with regional and global trade priorities.

178+ Reporters countries & territories
558+ Products agricultural items
38yrs Time Horizon 1986 – 2024
$66.3T Flows Tracked cumulative trade value
πŸ”Ž Filter by Reporter Partner Product / Item Year Trade Flow Horizon

Open Dashboard

Quick User Manual

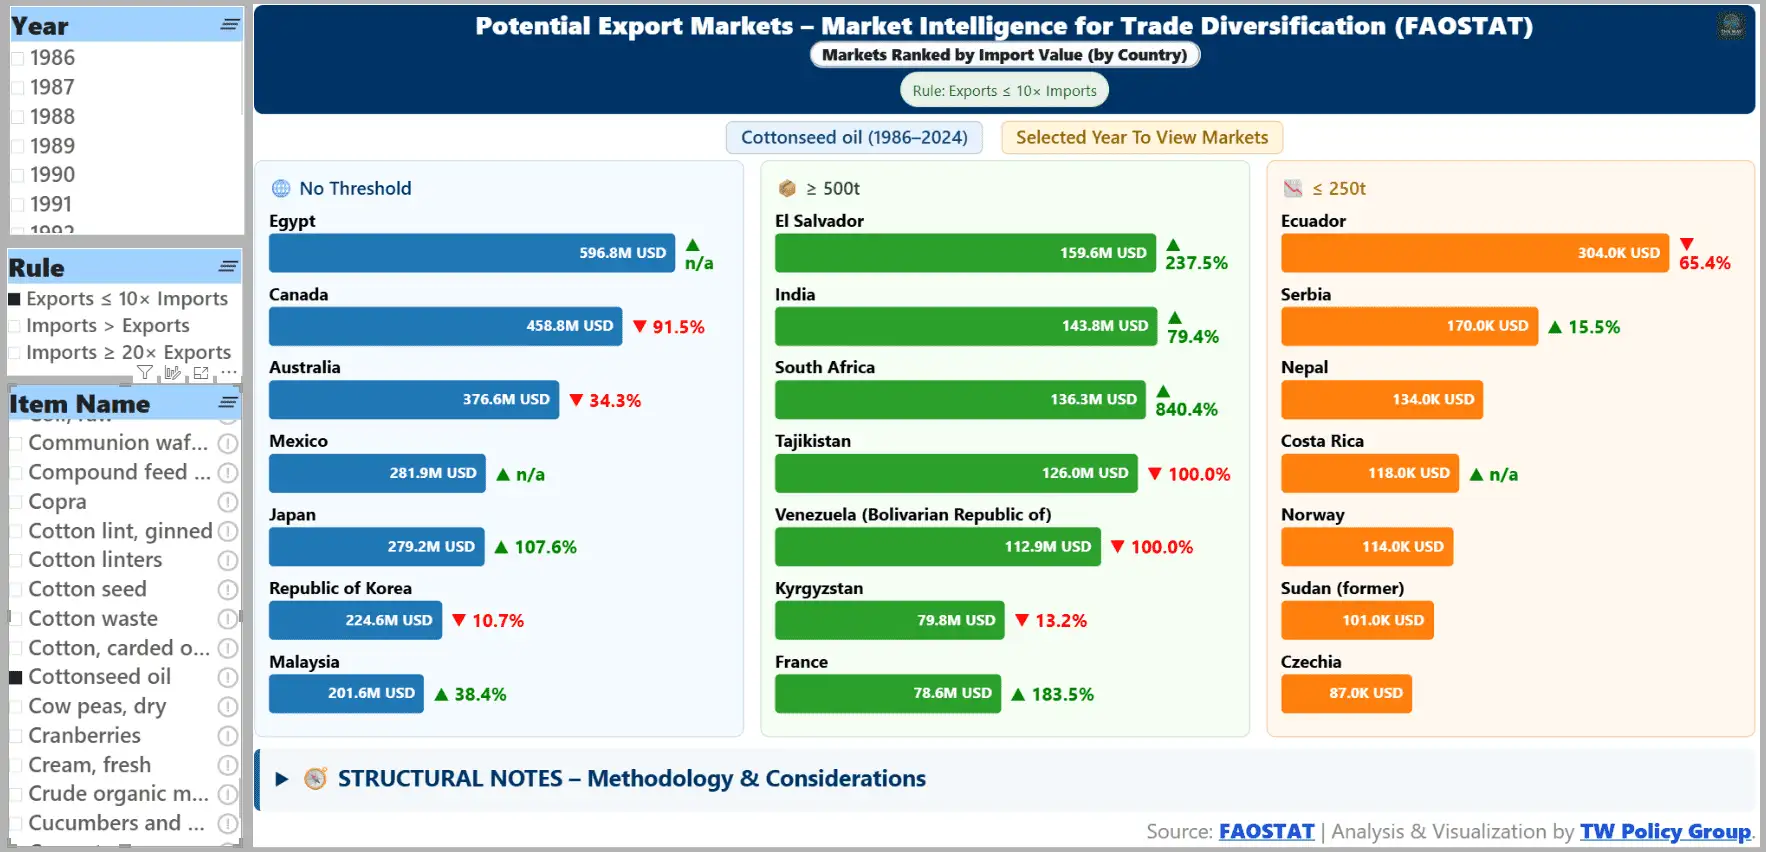
This page is fully dynamic. Use the embedded dashboard to view trade relationships, detailed product flows, and comparative market structures across countries and regions.

What you’ll see: an interactive trade matrix and professional dashboard views showing how agricultural trade evolves across reporters, partners, products, and trade directions.

  • Start broad: open the dashboard in its global view to understand the overall trade structure.
  • Filter strategically: narrow by Reporter, Partner, Product, Year, or Trade Flow to isolate the exact corridor or market relationship you want to study.
  • Track direction of trade: review who exports to whom, where dependencies are concentrated, and how market linkages evolve.
  • Assess trade balance: compare imports, exports, net positions, and composition shifts across products and partners.
  • Identify concentration risk: use matrix views and partner shares to detect over-reliance on a small number of destinations or suppliers.
  • Spot diversification opportunities: compare markets, products, and corridors to frame export promotion and trade facilitation strategies.
  • Use insight cards: combine the visuals with brief, practical signals for policy notes, donor dialogue, and commercial intelligence.

How this dashboard is built

01 Data Source & Coverage

Built on the FAOSTAT Detailed Trade Matrix, published by the Food and Agriculture Organization of the United Nations β€” the authoritative global reference for bilateral agricultural trade.

  • 178 reporter countries and territories covering every major producing and consuming market.
  • 558 agricultural products (primary and processed) mapped at FAOSTAT item level.
  • 38 years of coverage (1986–2024), including export, import, and re-export flows for every reporter–partner pair.
  • Trade values expressed in nominal USD and quantities in standard physical units.
02 Refresh Cadence & Version Control

FAOSTAT releases annual updates to the Detailed Trade Matrix as new country submissions are validated and reconciled.

  • Annual refresh aligned with the FAOSTAT publication cycle.
  • Historical revisions flow through automatically when FAO back-revises older years.
  • Version stamp reflects the most recent FAOSTAT snapshot integrated into the dashboard.
  • Users should treat the latest 1–2 years as provisional until country submissions are fully reconciled by FAO.
03 Methodology & Interpretation Notes

TW Policy Group applies a consistent, transparent processing layer over the raw FAOSTAT data so comparisons across reporters, partners, and products remain reliable.

  • Mirror reconciliation: where reporter and partner values diverge, the dashboard preserves both perspectives so users can see reporting asymmetries.
  • Partner concentration is computed using CR5 (top-5 partner share) to flag single-market dependency risk.
  • Product concentration uses PC5 (top-5 product share) to indicate export basket breadth.
  • Trade balance = exports βˆ’ imports at reporter level, with net positions tracked over time.
  • Eligibility rules: indicators are hidden where a reporter has fewer than 3 reporting years or fewer than 5 active partners, to avoid small-sample distortion.
  • Caveats: FAOSTAT trade data reflect country submissions and may differ from UN Comtrade or national trade accounts. Always pair with domestic trade statistics for decisions that carry fiscal weight.

Snapshot of Trade Matrix Views

🌐 Executive overview β€” global trade matrix

Start here: the full global picture on one screen

The executive overview collapses 38 years of bilateral agricultural trade into a single readable surface. It is designed as the entry point for analysts, negotiators, and senior decision-makers who need situational awareness before drilling into specific corridors or products.

  • Read global export and import totals in current USD across the full 1986–2024 horizon.
  • Spot the structural winners, net-importing blocs, and corridors that carry the bulk of global flows.
  • Anchor every downstream filter β€” reporter, partner, product, year β€” against a clean baseline.

Strategic Value for Policymakers & Partners

Global Market Intelligence

Track agricultural trade relationships across reporters, partners, and commodities to understand who trades what, with whom, and at what relative scale.

Trade Policy Diagnostics

Use the matrix to identify concentration risks, bilateral dependence, diversification opportunities, and structural imbalances relevant for negotiations and policy reform.

Export Diversification Support & Competitiveness

Identify concentration risks, underused destinations, and promising product corridors to inform export promotion, market access, and investment planning.

Donor & Programme Design

Translate trade patterns into investment priorities for value chains, logistics, standards, market access, regional trade facilitation, and rural transformation..

Benchmarking & Comparative Analysis

Compare countries, regions, trade corridors, and products across time, in one structured environment to prioritize programs, partnerships, and resource allocation.

Executive-Ready Communication

Use polished matrix snapshots and filters to create briefing notes, board presentations, partner updates, and strategic memoranda.

Portfolio Integration

Embed the dashboard in national portals, programme websites, and internal analytical workflows for ongoing monitoring and rapid trade intelligence access.

Scalable Trade Architecture

Extend the page with more products, country modules, tariff overlays, AI Q&A, custom KPIs, AI summaries, and related trade policy intelligence over time.

Data Disclaimer

Data & Attribution. This page presents a TW Policy Group visualization and trade intelligence interface built for public-use analysis and decision support. Any underlying source datasets, trade classifications, or methodology notes should be cited separately where applicable.

Open Access. Published as a public reference to support evidence-based trade policy, market access analysis, and alignment with global frameworks (WTO, AfCFTA, RTAs). Redistribution is permitted with clear attribution to FAO as the data source and TW Policy Group for the analysis and visualization. Please consult FAO’s Data Terms of Use and attribution guidance on the official FAO website.

No endorsement. FAO does not endorse any findings or interpretations. Any errors or interpretations are the sole responsibility of TW Policy Group.

Engage β€’ Feedback & Updates

Feedback & Questions

Share a question, request an enhancement, or flag a trade-data issue. Your feedback helps improve usability, interpretation, and strategic value.

Subscribe for Updates

Receive updates on new trade dashboards, methods notes, and opportunities for tailored analysis.