Africa Agricultural Trade (1986–2024)

Premium-access dashboard powered by the FAOSTAT Detailed Trade Matrix, developed by TW Policy Group to track African agricultural trade flows, trade balances, product dynamics, reporter–partner linkages, concentration risks, and market structure. Built to support evidence-based trade strategy, export diversification, AfCFTA implementation, food systems planning, and alignment with continental and regional trade priorities.

54 Reporters African reporting countries
252+ Products crops & livestock items
38yrs Years of Data 1986 – 2024
51.7B Flows Tracked kUSD cumulative coverage
🔎 Filter by Year Reporter Countries Item Partner Countries Partner Scope Horizon

Open Dashboard

Quick User Manual

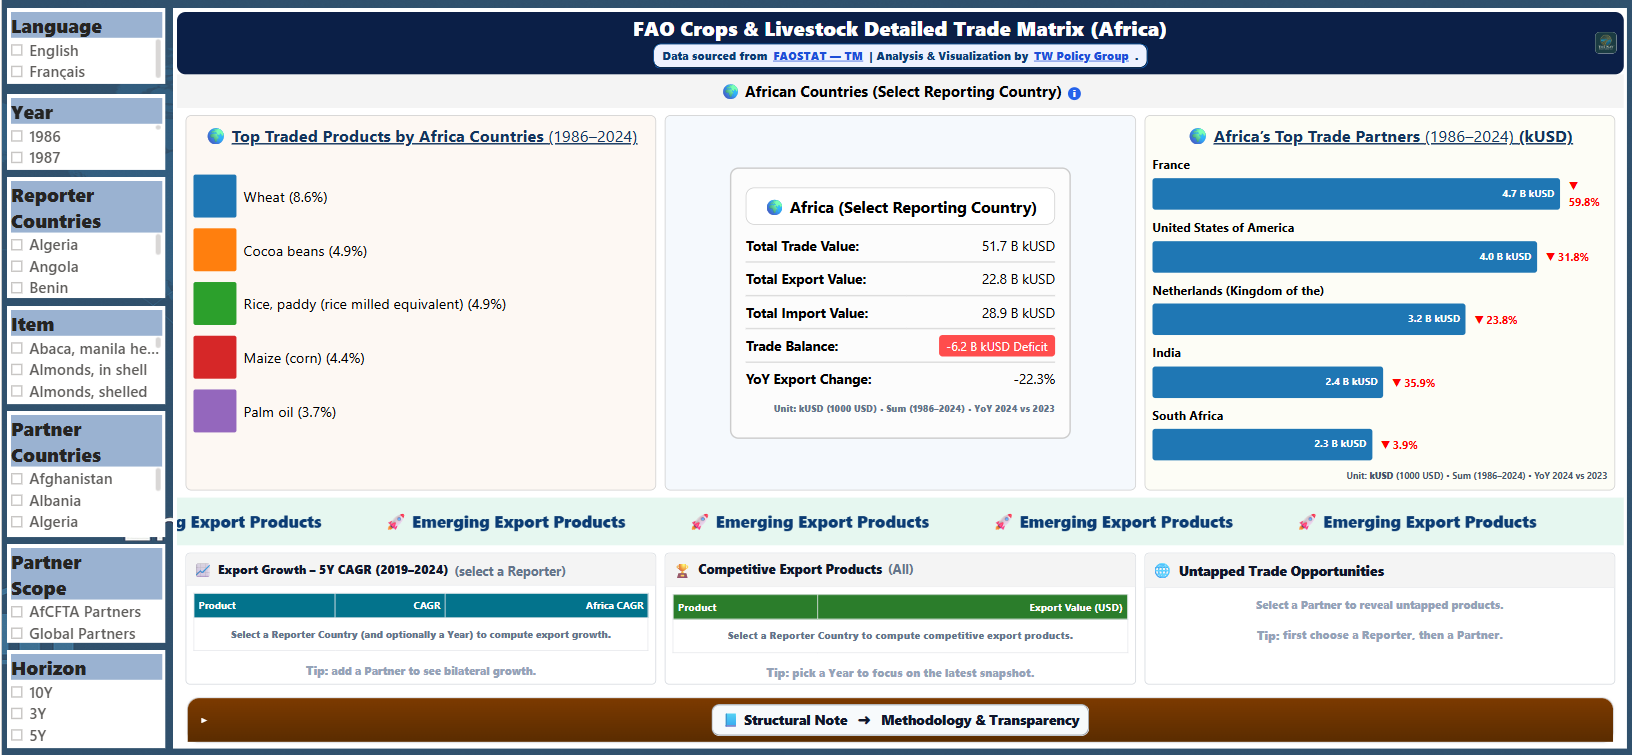
This page is fully dynamic. Use the embedded dashboard to examine African agricultural trade relationships, bilateral product flows, partner concentration, trade balances, and emerging export opportunities in a premium decision-ready format.

What you’ll see: a live African trade matrix and analytical views showing how agricultural trade evolves across reporters, partners, products, and time horizons.

  • Start with Africa-wide context: open the dashboard in its broad regional view to understand overall trade structure before narrowing to a single country.
  • Filter strategically: refine by Year, Reporter, Item, Partner, Partner Scope, and Horizon to isolate corridors, products, or trends.
  • Track direction of trade: review who exports to whom, where import dependencies are concentrated, and how partner linkages shift over time.
  • Assess trade balance: compare exports, imports, total trade value, and deficits or surpluses for each selected reporter.
  • Identify concentration risk: use top products and top partners to detect over-reliance on a small number of commodities or destinations.
  • Read growth and competitiveness: examine emerging export products, competitive products, and untapped opportunities where partner selection is available.
  • Use for policy and investment planning: turn the visuals into donor briefs, country strategy notes, AfCFTA analysis, and trade facilitation dialogue.

How this dashboard is built

01 Data Source & Coverage

Built on the FAOSTAT Detailed Trade Matrix, filtered to 54 African reporter countries and their bilateral trade with all global partners.

  • 54 African reporters covering every AU member state with available trade data.
  • 252+ agricultural products actively traded by African reporters at FAOSTAT item level.
  • 38 years of coverage (1986–2024), including export, import, and re-export flows.
  • Trade values expressed in nominal USD (source unit: 1000 USD, display × 1000).
02 Refresh Cadence & Analytical Use

FAOSTAT releases annual updates to the Detailed Trade Matrix as new country submissions are validated and reconciled.

  • Annual refresh aligned with the FAOSTAT publication cycle.
  • Historical revisions flow through automatically when FAO back-revises older years.
  • Version stamp reflects the most recent FAOSTAT snapshot integrated into the dashboard.
  • Users should treat the latest 1–2 years as provisional until country submissions are fully reconciled by FAO.
03 Interpretation Notes

The dashboard is designed to make complex bilateral trade relationships readable for both technical and executive audiences.

  • Top products help reveal commodity dependence and concentration risk.
  • Top partners surface the strongest trade corridors and market exposure patterns.
  • Country summaries condense trade balance, export, import, and year-on-year shifts into one actionable view.
  • Emerging export products help identify growth, competitiveness, and possible untapped opportunities.

Snapshot of Trade Matrix Views

🌍 Africa trade matrix — executive overview

Start with the full African trade picture

This opening view provides a premium, decision-ready snapshot of agricultural trade across African reporting countries. It helps users orient themselves before drilling into a reporter, product, partner, or time horizon.

  • See Africa-wide traded value, product leaders, partner relationships, and overall structure in one view.
  • Use this as the baseline for comparing country-specific trade performance against the broader continent.
  • Anchor later filters against a clear regional frame before narrowing into detail.

Strategic Value for Policymakers & Partners

Africa-Focused Trade Intelligence

Track agricultural trade relationships across African reporters, products, and partners to understand where value is concentrated and how trade structures evolve over time.

AfCFTA & Policy Diagnostics

Use matrix views to assess trade balance, partner dependence, and product concentration in a way that translates directly into policy design and negotiation positioning.

Export Diversification & Competitiveness

Identify product concentration, promising corridors, and underexploited trade relationships that can inform export promotion and industrial upgrading strategies.

Country Strategy & Donor Programming

Convert observed trade patterns into priorities for value-chain support, standards, logistics, border efficiency, and market systems development.

Comparative Benchmarking

Benchmark African reporters across decades to see who is deepening competitiveness, where diversification is strongest, and where deficits remain entrenched..

Executive-Ready Communication

Use trade matrix snapshots to create board notes, ministerial briefings, partner memoranda, and strategy decks without additional redesign.

Untapped Trade Opportunity Discovery

Move from descriptive trade analysis into product-level bilateral opportunities that align with existing importer demand and exporter capability.

Scalable Architecture

Extend with tariff overlays, AfCFTA schedules, AI Q&A, custom KPIs, and additional datasets to future-proof Africa's agricultural trade intelligence.

Data Disclaimer

Data & Attribution. This page presents a TW Policy Group visualization and trade intelligence interface built for professional public-use analysis and decision support. The underlying trade records are based on the FAOSTAT Detailed Trade Matrix.

Open Access. Published as a public reference to support evidence-based agricultural trade policy, market access analysis, export strategy, and regional alignment with frameworks including AfCFTA. Redistribution is permitted with clear attribution to FAO as the data source and TW Policy Group for the analysis and visualization. Please consult FAO’s Data Terms of Use.

No endorsement. FAO does not endorse any findings or interpretations shown on this page. Any errors or interpretations are the sole responsibility of TW Policy Group.

Engage • Feedback & Updates

Feedback & Questions

Share a question, request an enhancement, or flag a trade-data issue. Your feedback helps improve usability, interpretation, and strategic value.

Subscribe for Updates

Receive updates on new Africa trade dashboards, methods notes, and opportunities for tailored analysis.