Global Fertilizer Trade
Trade Analytics · 1990–2023

Global fertilizer trade flows, market structure, and long-run trade performance across reporting economies

Interactive dashboard for Global Fertilizer Trade, built to track long-run fertilizer trade flows across 190 reporter countries, 27 fertilizer products, and more than 33 years of data from 1990 to 2023. Designed for ministers, trade analysts, agribusiness leaders, market strategists, development partners, and input-sector specialists who need a clean, executive-grade view of fertilizer trade scale, composition, direction, and cumulative value across the global market.

190 Reporter Countries Global reporting coverage
27 Fertilizer Products Product-level trade scope
33+ yrs Time Horizon 1990 – 2023
$3.8T Flows Tracked Cumulative trade value
🔎 Filter by Reporter Partner Year Product Trade Flow Value / Volume

🌍 Global Fertilizer Trade — Interactive Dashboard

Executive Snapshot

Global Market Coverage

This page brings together long-run fertilizer trade activity across a broad global reporting base, allowing users to move quickly from worldwide trade structure to reporter- and partner-level patterns.

Product-Level Trade Visibility

With 27 fertilizer products in scope, the dashboard supports focused analysis across major fertilizer categories, trade corridors, and product-specific market behavior over time.

Long-Run Trade Perspective

The 1990–2023 series enables analysts to identify structural expansion, market shocks, trade reorientation, and long-run shifts in global fertilizer trade relationships.

Cumulative Trade Scale

With $3.8 trillion in cumulative flows tracked, the page provides an executive lens on the scale and persistence of fertilizer trade in the global agricultural input economy.

Policy and Market Use

Built for trade diagnostics, supply-chain mapping, import dependency analysis, exporter concentration review, strategic procurement planning, and executive-level market communication.

Premium Fertilizer Identity

This page uses its own premium visual language with a mineral-blue fertilizer trade identity, stronger hierarchy, and broader hero spacing than the agricultural trade pages.

Key Data Points

Coverage 190 reporter countries across the global fertilizer trade system
Products 27 fertilizer products tracked across the dashboard
Time Range 1990–2023, giving 33+ years of trade history
Scale $3.8 trillion cumulative fertilizer trade value tracked
Best Use Trade benchmarking, input market analysis, policy review, and supply-chain strategy

Quick User Manual

This page is fully interactive. Every chart, total, ranking, and trade pattern changes dynamically with the selected reporter, partner, product, flow, and year.

Recommended reading flow: begin with the global overview, narrow to a reporter country, then compare partners, products, and trade flow direction to identify the most relevant trade pattern.

  • Start broad: first read the global fertilizer trade picture before filtering to a specific country.
  • Select reporter and partner carefully: reporter-side and partner-side choices should reflect the trade question you are asking.
  • Choose the product: isolate the exact fertilizer product to avoid mixing market signals across different input categories.
  • Anchor the year: always note the selected year when quoting a figure in any report or presentation.
  • Read direction correctly: exports and imports should be interpreted separately before drawing trade balance conclusions.

Methodology & Interpretation Notes

01 Coverage and time horizon

This page presents fertilizer trade data for 1990–2023 across 190 reporter countries and 27 fertilizer products, supporting long-run trade review across the global agricultural input market.

02 Reading reporter, partner, and product filters

Trade results should always be interpreted in the context of the selected reporter, partner, product, and trade flow. Changing any one of these selections may materially alter the result.

03 Comparing values over time

Long-run trade comparisons are strongest when the same product and trade direction are held constant. Use multi-year reading rather than one-off spikes to understand structural market shifts.

04 Using the dashboard for policy and market strategy
  • Assess import dependence and exporter concentration.
  • Identify major suppliers and vulnerable trade corridors.
  • Support fertilizer access, affordability, and procurement planning.
  • Benchmark national trade exposure against global market flows.
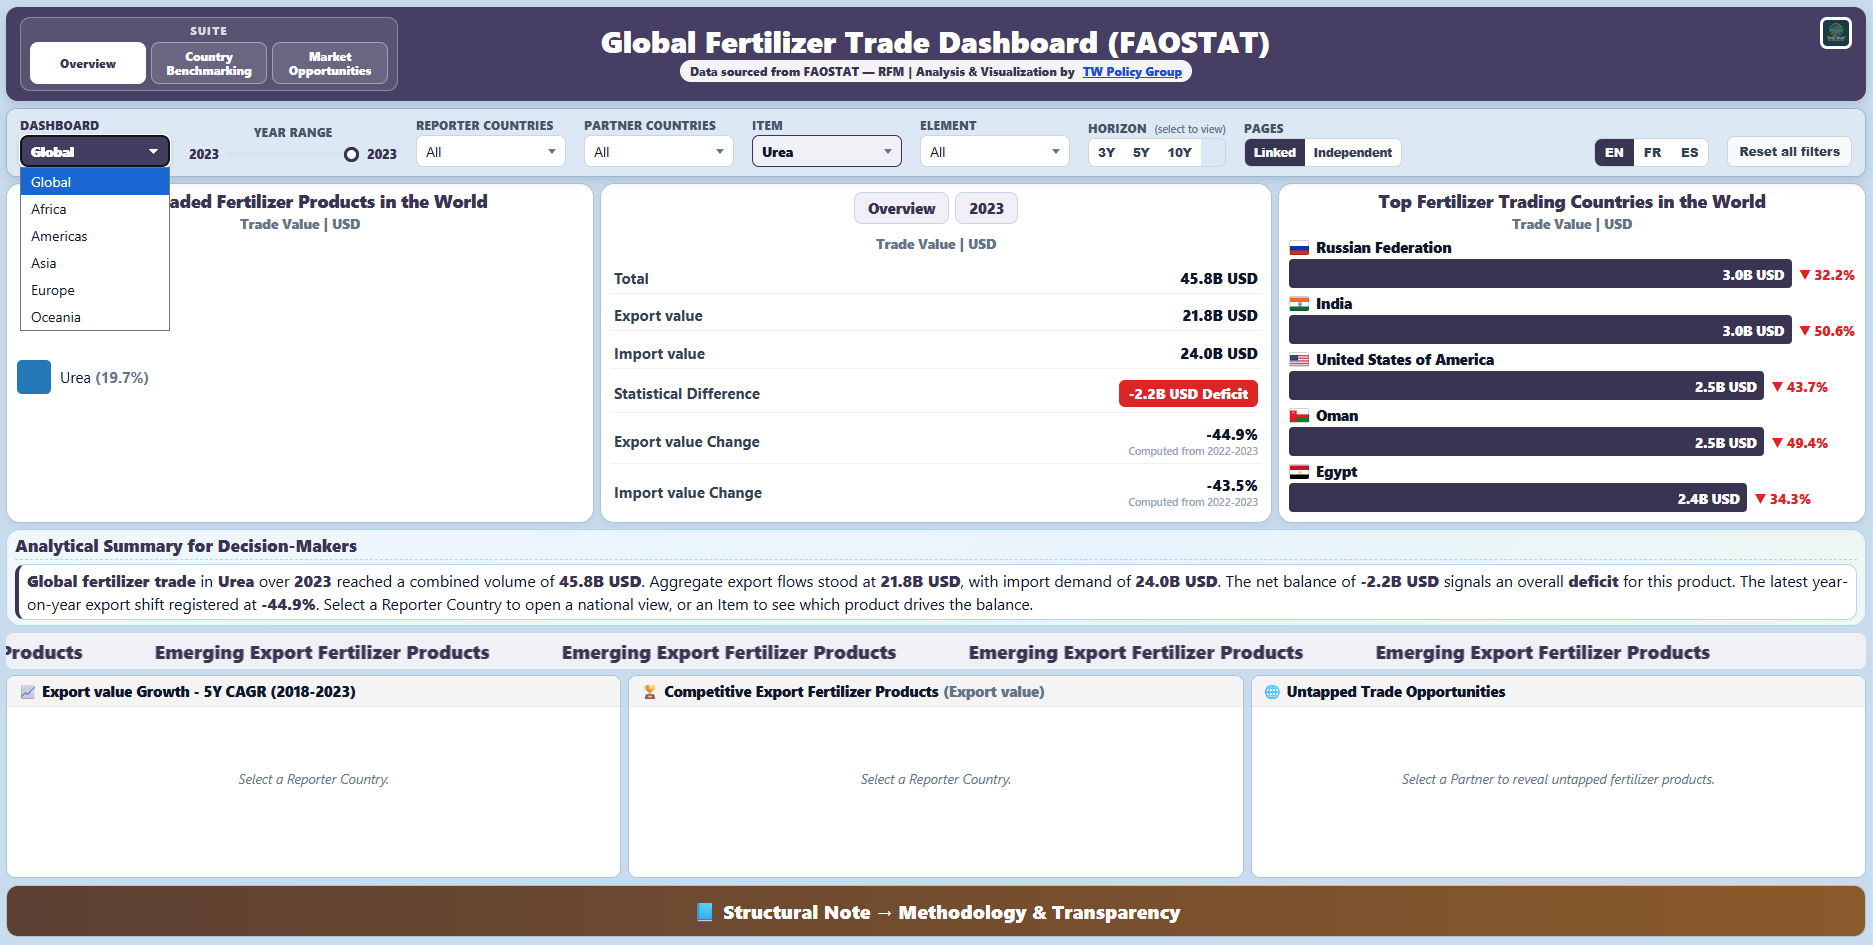
Global Fertilizer Trade Visual Snapshot
Global Fertilizer Trade dashboard overview
Overview Snapshot

Global fertilizer trade structure at a glance

This premium visual gives users a fast executive reading of the fertilizer trade landscape, helping them identify large flows, important reporting economies, product distribution patterns, and the broader structure of the global fertilizer market before moving into filtered analysis.

Strategic Value for Trade Policymakers, Market Analysts, and Input-Sector Leaders

Import Dependency Review

Assess how strongly countries depend on imported fertilizer products and identify where supply risks may be structurally high.

Exporter Concentration

Track whether a country’s fertilizer sourcing is diversified or concentrated among a narrow set of partners.

Trade Corridor Mapping

Use reporter–partner analysis to identify important fertilizer corridors, trade shifts, and evolving supply relationships.

Product-Specific Market Analysis

Compare different fertilizer products to distinguish broad market trends from category-specific dynamics.

Procurement and Supply Planning

Support strategic sourcing, procurement timing, and input access planning with a structured trade evidence base.

Executive Communication

Translate large global trade datasets into premium, decision-ready visuals suitable for briefings, strategy notes, and stakeholder presentations.

Long-Run Market Positioning

Use the 1990–2023 series to understand how countries and products have moved over time rather than relying on one-year snapshots.

Global Input Security Perspective

Connect fertilizer trade performance to broader food systems, agricultural productivity, and strategic input security discussions.

Data Disclaimer

Data & Presentation. This page presents a TW Policy Group premium visualization interface for Global Fertilizer Trade, designed for policy, strategy, and market analysis.

Interpretation note. Figures shown in the dashboard should always be interpreted in the context of the selected reporter, partner, product, trade flow, and year. Comparisons are strongest when the analytical scope is kept constant.

Use in reporting. When citing values externally, users should specify the exact filter context visible in the dashboard at the time the figure was read.

Engage • Feedback & Updates

Feedback & Questions

Ask a question, request a refinement, or share a suggested improvement for the Global Fertilizer Trade page.

Get Dashboard Updates

Subscribe for updates on new agriculture dashboards, production analytics, TW Policy Group releases, and fertilizer-focused dashboard updates.

Fertilizer trade analytics • Global market tracking