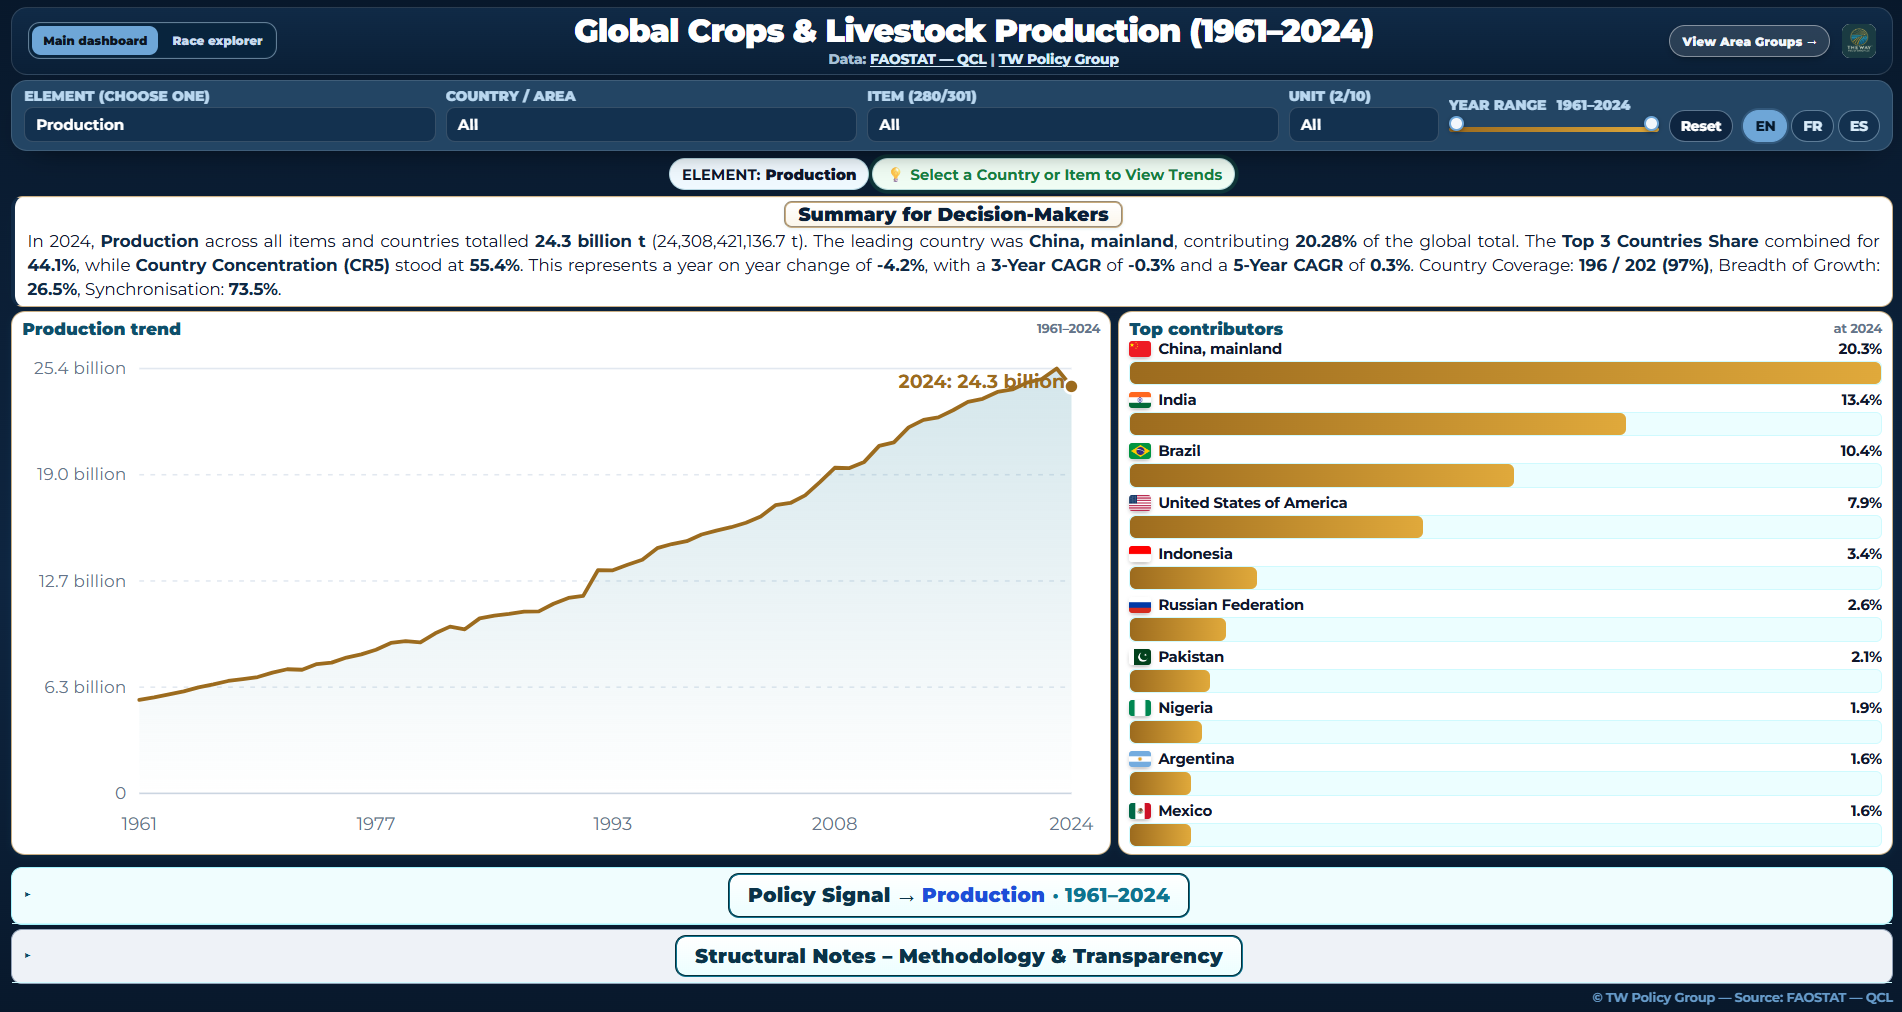
Global Crops & Livestock Products Dashboard
Continuous access to global crops and livestock production intelligence covering countries, commodities and production indicators through one multilingual analytical platform.
$999
per year
- Complete Global Crops & Livestock Products Dashboard
- Full historical database from 1961 to 2024
- Global country, commodity and production-indicator coverage
- Production Overview and Trend Explorer
- Executive summaries, Production Pulse and Deep Signals
- Automated Policy Signals and historical rankings
- Interactive filtering, comparisons and exportable visualisations
- Multilingual interface: English, French and Spanish
- Continuous data and platform updates
- Unlimited dashboard access and email support
Best for: Government ministries • Development organisations • Researchers • Universities • Consultants • Investors • Global agribusinesses