Global Fisheries ODA Scale
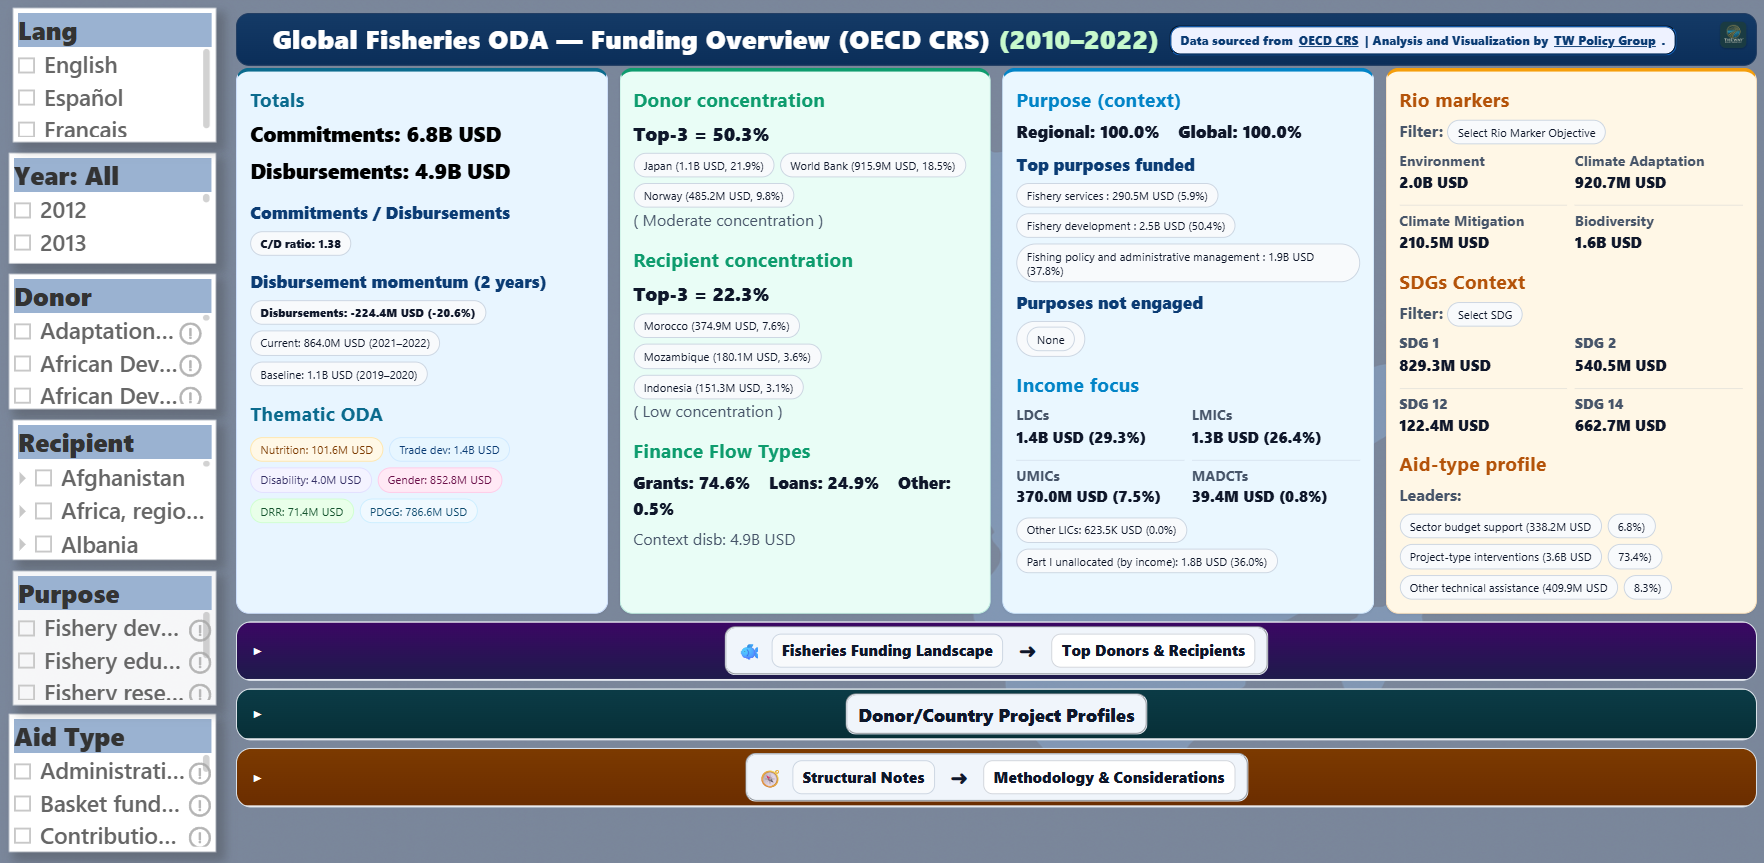
Overall fisheries ODA reached $6.8B in commitments and $4.9B in disbursements across the 2010–2022 period, confirming fisheries as a meaningful development finance domain within food systems and livelihoods support.
Official Development Assistance Analytics · 2010–2022
Fisheries finance dashboard powered by OECD CRS / DAC aid activity data, developed by TW Policy Group to track overall Official Development Assistance flows into fisheries across 61 donors, 165 recipients, finance instruments, project modalities, and delivery pipelines. Built to support fisheries sector strategy, donor coordination, project targeting, investment intelligence, and evidence-based development planning.
Overall fisheries ODA reached $6.8B in commitments and $4.9B in disbursements across the 2010–2022 period, confirming fisheries as a meaningful development finance domain within food systems and livelihoods support.
A total of 61 donors contributed to fisheries financing, creating a diversified funding ecosystem that combines bilateral, multilateral, and pooled financing channels.
Fisheries ODA reached 165 recipients, demonstrating broad geographic penetration and supporting coastal economies, livelihoods, food access, and sector strengthening across developing regions.
The dashboard distinguishes 3 core finance types; grants, loans, and equity, allowing users to see how fisheries assistance is structured and where concessional versus investment-oriented support dominates.
Beyond headline volumes, the platform captures a wide spectrum of aid types and intervention modalities, from project-type interventions and technical assistance to budget support and pooled funding mechanisms.
Designed for governments, donors, fisheries agencies, development partners, and investors who need credible evidence for sector strategy, donor mapping, project design, and financing discussions.
This page is fully dynamic. Use the embedded dashboard to explore overall fisheries ODA flows, identify top donors and recipients, compare financing instruments, and review large funded projects across the 2010–2022 period.
What you'll see: an interactive fisheries development finance interface showing how official development assistance is allocated — by donor, recipient, aid type, finance type, project size, and delivery profile.
This dashboard captures a wide range of OECD CRS aid modalities relevant to fisheries development finance, making it possible to distinguish not only how much is financed, but also how support is delivered.
Built on the OECD Creditor Reporting System (CRS), this dashboard consolidates fisheries-related ODA activity data into a single premium intelligence interface for development finance analysis.
The dashboard is designed for ongoing fisheries development finance tracking as OECD CRS activity data are updated and integrated into the TW Policy Group model.
This page is designed to support decision-grade fisheries finance analysis by preserving both funding size and delivery modality.
This overview image shows the dashboard in its most interactive form, with slicers visible for drilling into donors, recipients, finance types, and other filters. It is the best starting point for users who want to navigate the full fisheries ODA landscape from a single control surface.
Map the institutions financing fisheries development, identify leading donors, and understand concentration in the fisheries ODA ecosystem.
Identify which countries attract the most fisheries ODA and where funding gaps may remain for project preparation or programme expansion.
Distinguish grants, loans, and equity to understand the financing architecture underpinning fisheries sector support.
Use project rankings to benchmark fisheries operations, compare portfolio scale, and identify flagship interventions.
Translate funding evidence into concept notes, donor engagement strategies, fisheries value-chain proposals, and sector reform packages.
Monitor the gap between pledged and delivered finance to support accountability, implementation review, and pipeline diagnostics.
Produce professional briefings, presentations, donor dialogues, and strategy papers grounded in clear fisheries finance evidence.
Extend the page with country modules, trade overlays, capture production signals, and deeper sector-specific finance analytics over time.
Data & Attribution. This page presents a TW Policy Group visualization and fisheries ODA intelligence interface built on OECD Creditor Reporting System (CRS) data. Any underlying source datasets, activity classifications, or methodology notes should be cited separately where applicable.
Open Access. Published as a public reference to support evidence-based fisheries development policy, donor coordination, and sector financing analysis. Redistribution is permitted with clear attribution to the OECD DAC as the source and TW Policy Group for the analysis and visualization.
No endorsement. The OECD does not endorse any findings or interpretations contained in this dashboard. Any errors or interpretations remain the sole responsibility of TW Policy Group.
Share a question, request an enhancement, or flag a data issue. Your feedback helps improve usability, interpretation, and strategic value of the Overall Fisheries ODA dashboard.
Receive updates on new fisheries dashboards, finance notes, and tailored development finance intelligence.