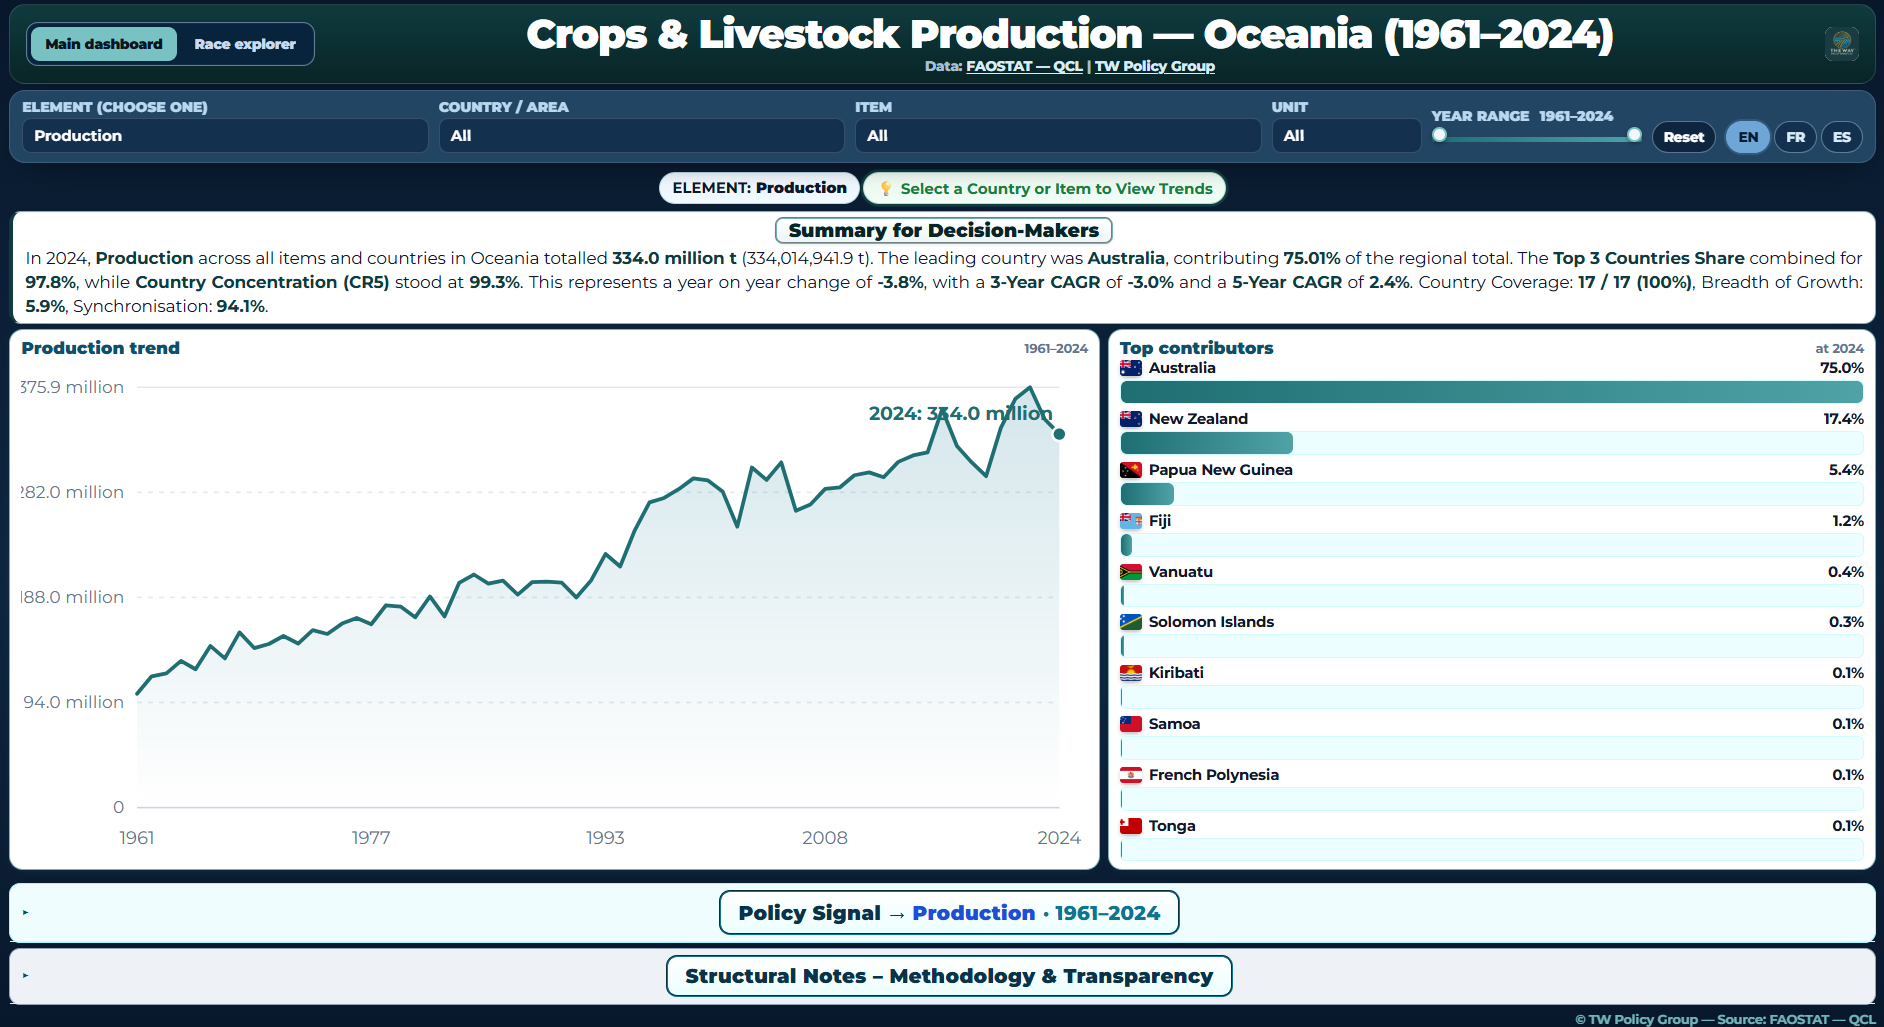
✓Two interactive pages. The Overview page carries the Summary for Decision-Makers, Policy Signals and the animated bar race. Trend Explorer carries the KPI strip, long run trend line, Top 10 leaderboard and composition donut.
✓Decision maker summary. A plain language brief that writes itself for any country, item, element and year you select.
✓Policy Signal panel. 11 live signals: top producer, Top 3 share, CR5 / PC5 concentration, YoY, 3 and 5 year CAGR, breadth of growth, synchronisation, acceleration and level change.
✓Rankings and composition. Top 10 country leaderboards plus a product composition donut for the selected scope.
✓Long run trend lines. Full 1961 to 2024 series with a 5 year moving average to read momentum cleanly.
✓8 elements across 10 units. Production, area harvested, yield, yield/carcass weight, stocks, producing and slaughtered animals, milk and laying counts, each kept in its correct unit.
✓Pacific depth. 17 Oceania countries and territories, 224 crop and livestock products, more than six decades of history.
✓Five way filtering. Slice instantly by Year, Item, Country, Element and Unit to isolate exactly what you need.
✓Methodology and transparency. Built in structural notes, interpretation bands and the formulas behind every signal.
✓Briefing ready. Clean, presentation grade views for ministers, boards, investors and donor partners.
✓Annual refresh included. Your 12 months of access covers the next FAOSTAT data refresh integrated into the model.
✓English edition. A single, focused English dashboard built for Pacific institutions, partners and analysts.